ASX COMPANY FACT RECORD
Fortescue — company, asset and project record
Iron ore operations, growth projects, energy portfolio, capital and operating metrics.
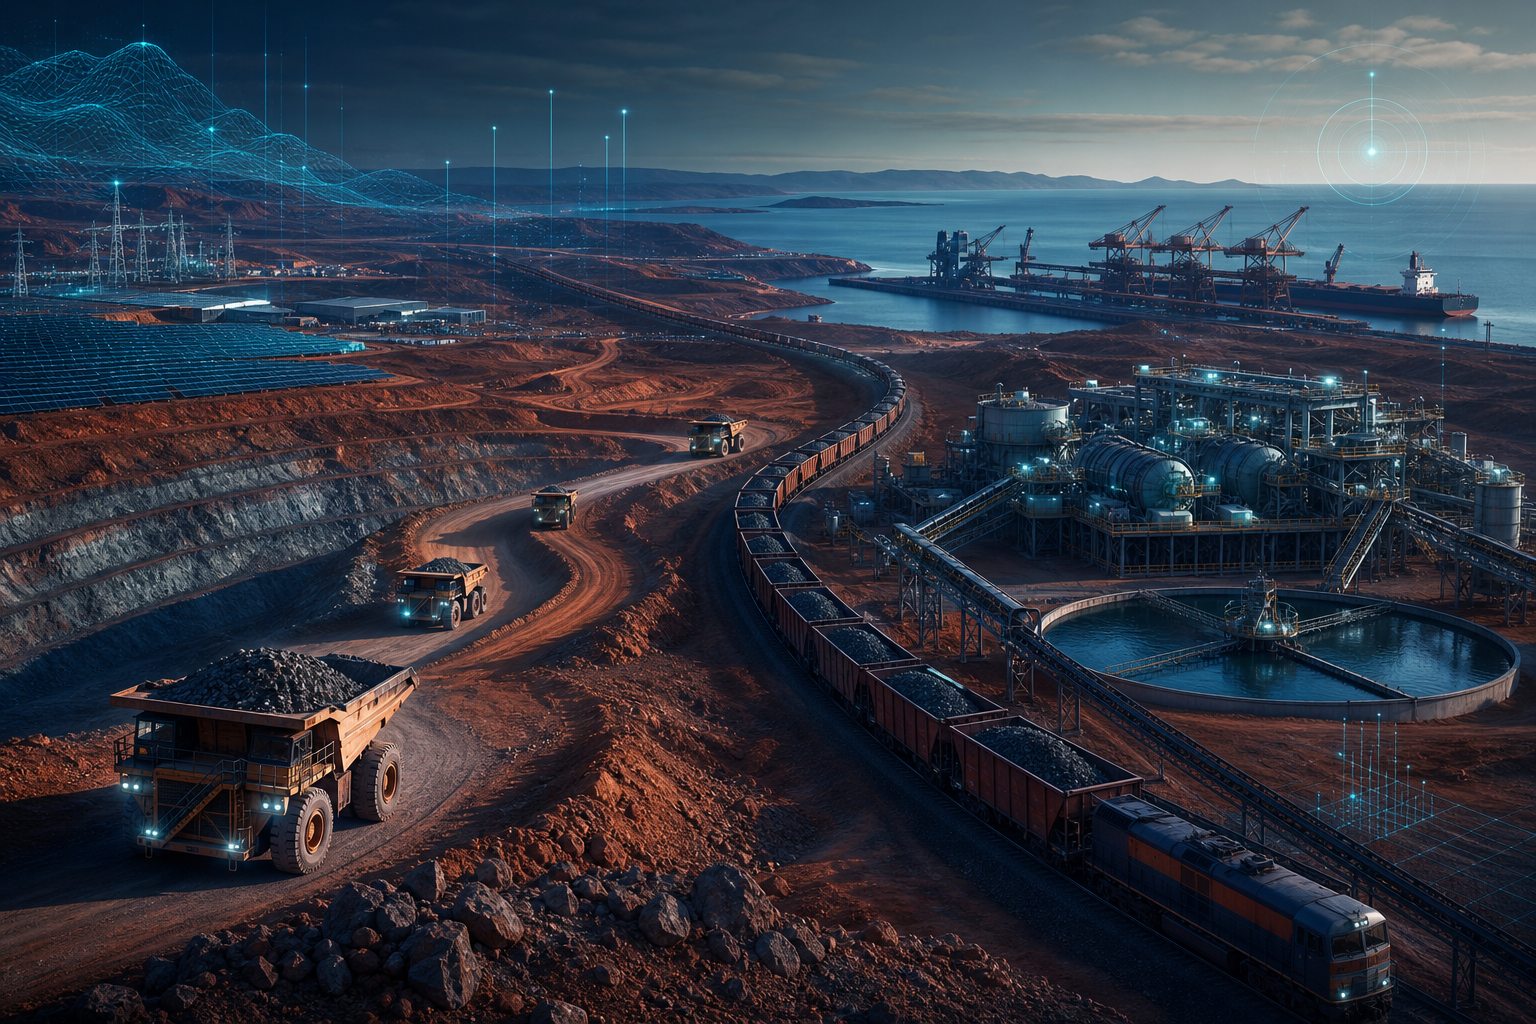
01
1. Corporate identity, reporting perimeter and evidence rules
Reporting entity and five-year boundary
Fortescue Ltd is an Australian incorporated, for-profit public company. The five selected reports cover financial years ended 30 June 2021, 2022, 2023, 2024 and 2025. Earlier reports call the issuer Fortescue Metals Group Ltd; the FY25 report identifies Fortescue Ltd as the reporting company. This record keeps the issuer's contemporary names where necessary, but treats the five reports as one historical reporting sequence rather than as five comparable snapshots without qualification.
The company was established in 2003. Across the period, its annual reports describe a Western Australian iron-ore business built around wholly owned Pilbara mines, processing facilities, railway and port infrastructure, alongside the formation and subsequent development of an energy and green-technology business. The reports should not be read as giving one unchanged segment boundary throughout the full five years.
| Reporting year | Corporate/reporting frame stated in the annual report | Boundary relevant to this record |
|---|---|---|
| FY21 | Iron-ore operations, associated Pilbara infrastructure, Iron Bridge and the newly established Fortescue Future Industries (FFI) were described in the group framework. | FFI was a 100%-owned renewable green-energy and industry company; FY21 financial/operating discussion still principally presented the established iron-ore system. |
| FY22 | The report identified two operating segments: Iron Ore and FFI. Corporate cash, debt and tax were managed at Group level and were not an operating segment. | Iron Ore included exploration, development, production, processing, sale and transport of iron ore and other-mineral exploration. FFI covered green electricity, hydrogen and ammonia project development. |
| FY23 | Fortescue described two divisions: Metals and Energy. | Energy comprised FFI, Fortescue Hydrogen Systems and Fortescue WAE. Fortescue WAE was moved from Metals to Energy, and FY22 segment comparatives were restated to match that presentation. |
| FY24 | The group described itself as an integrated technology, energy and metals group. | Metals retained the iron-ore/exploration/transport activities; Energy covered global green-electricity, hydrogen, ammonia and green-technology development/manufacturing. Corporate remained a central, non-operating-segment category. |
| FY25 | The consolidated statements covered Fortescue Ltd and subsidiaries; two operating segments remained Metals and Energy. | Metals included iron-ore exploration through transport/sale and other-mineral exploration. Energy included global green electricity, hydrogen and ammonia projects and green-technology development/manufacturing. Group cash, debt, intercompany loans and tax were managed in Corporate. |
Operating perimeter reported through the period
The recurrent Pilbara physical system comprises the Chichester Hub (Cloudbreak and Christmas Creek), Solomon Hub (Firetail, Kings Valley and Queens Valley in FY22–FY23 descriptions), and the Western Hub. The annual reports’ exact hub terminology changes: FY21–FY23 separately describe Chichester, Solomon and Western Hub/Eliwana; FY24–FY25 overview wording groups Solomon and Eliwana in a broader Western Hub description. That wording change does not establish that individual mines, reserves or production became interchangeable. This report therefore keeps hub, mine, deposit and group-level facts separate.
All five reports describe a mine–processing–rail–port operating system linking Pilbara production to Herb Elliott Port and Judith Street Harbour at Port Hedland. The railway is reported as 760 km in FY22–FY25. Herb Elliott Port is reported with five operating berths and, in the later reports, approval for up to 210 mtpa of iron-ore exports. The reports also refer to Fortescue Ore Carriers, tug operations, rail control and the Fortescue Hive/integrated operations centre. A group shipment total is not allocated to an individual mine in this record unless the source itself does so.
Iron Bridge is treated separately from hematite operations. It is an unincorporated joint operation held 69% by FMG Magnetite Pty Ltd and 31% by Formosa Steel IB Pty Ltd in the FY23–FY25 reports. Iron Bridge figures may be stated on a 100% joint-operation basis or on Fortescue’s 69% share basis. Those bases are retained as published; they are not added to or substituted for Pilbara hematite volumes.
Evidence and comparison rules
This is a factual five-year record built from the retained FY21–FY25 Fortescue annual-report exports. It does not provide a valuation, price target, securities recommendation, forecast or investment conclusion. The source occurrence controls the statement:
- Actual result / completed event means a production, shipment, financial, construction, commissioning, acquisition, safety or other event the annual report says occurred in or before that financial year.
- Plan, target, guidance, study or stated objective remains labelled as such, even when a later report discusses the same project. It is not rewritten as a completed result.
- Reporting basis remains visible. In particular: wet metric tonnes (wmt) and dry metric tonnes (dmt) are not combined; hematite and magnetite are not combined; Ore Reserves, Mineral Resources, inventory and production are separate record types; US dollars and Australian-dollar dividends are not converted or aggregated; and statutory NPAT, underlying NPAT and underlying EBITDA are separate issuer measures.
- Comparability is not assumed where Fortescue changed segment presentation, a project moved from construction to operations, an item is stated at 100% rather than attributable interest, or the annual report itself gives a changed accounting/resource basis. “Not separately disclosed” means the selected report did not provide a usable separate figure; it is not zero.
Principal assets and status at the end of the selected record
The FY25 report provides the latest selected reporting perimeter, but it is not used to rewrite earlier years. It describes the Pilbara hematite system, Iron Bridge magnetite, the Energy business, Fortescue Zero technologies, Green Metal work, Australian/international exploration and Belinga/Gabon activity. The asset-by-asset chronology, resource/reserve record and project status appear in later sections; the status map in Section 3 is a navigation device derived from the five reports, not an investment ranking or a substitute for the source tables.
Section sources
- Fortescue Metals Group Ltd FY21 Annual Report — Overview / “About Fortescue” and overview of operations, printed pp. 11–24; Operating and financial review, printed pp. 25–42; Financial Report, printed pp. 65–77.
- Fortescue Metals Group Ltd FY22 Annual Report — Overview / “About Fortescue” and “Our operations”, printed pp. 22–24; Operating and financial review, printed pp. 28–33; Financial statements, Note 2 “Segment information”, printed p. 85.
- Fortescue FY23 Annual Report — Overview, printed pp. 5–27; Operating and financial review—segment reporting, printed pp. 28–46; Financial Report, printed pp. 109–171.
- Fortescue FY24 Annual Report — Overview, printed pp. 2–26; Operating and financial review, printed pp. 27–43; Financial Report—segment information, printed pp. 150–224.
- Fortescue FY25 Annual Report — Overview, printed pp. 4–21; Operating and financial review, printed pp. 22–42; Financial Report—segment information and reporting entity, printed pp. 168–242.
02
2. FY2021–FY2025 group chronology
The chronology records material annual-report facts by year. Later outcomes are not backdated into earlier years, and a later target is not treated as an earlier actual result.
FY2021 — Eliwana moved into operations; Iron Bridge remained a development project; FFI established
| Evidence family | FY21 annual-report record |
|---|---|
| Pilbara operations | The group reported 226.9mt ore mined, 185.8mt processed, 182.2mt shipped and 181.1mt sold on a wet-metric-tonne basis. It recorded first ore through Eliwana’s OPF in December 2020, transfer of Eliwana mine and rail to Operations in January 2021, and a 30mtpa annualised processing rate within six months. Queens development at Solomon commenced production and supplied existing OPFs. |
| Hubs and logistics | Chichester’s autonomous-haulage project was completed. Christmas Creek WHIMS commissioned in December 2020 and ramped to capacity in the second half. Herb Elliott Port’s licensed throughput approval increased from 175mtpa to 210mtpa. The report recorded the group’s 1.5 billionth tonne shipment in April 2021. |
| Iron Bridge | Iron Bridge was a construction project designed for 22mtpa of 67% Fe magnetite concentrate. The FY21 technical/commercial assessment revised total completion capital to US$3.3–3.5bn. The report stated first production was scheduled by December 2022 and expected full run-rate ramp-up over 12–18 months; these were FY21 project expectations, not FY21 production results. |
| Energy and FFI | Pilbara Energy Connect (PEC) was described as a US$0.7bn programme: US$250m for high-voltage transmission and US$450m for gas generation, solar PV and battery storage. FFI was established as a wholly owned green-energy/industry company. FY21 FFI administration expense was US$104m and capex US$18m. The company’s February 2021 capital-allocation update set 10% of NPAT for FFI; the report recorded US$1,029m for FY21 under that policy. |
| Finance and distributions | Revenue was US$22,284m, underlying EBITDA US$16,375m and statutory NPAT US$10,295m. Cash was US$6,930m, total debt US$4,252m and net cash US$2,678m at year end. FY21 capex was US$3.633bn. The FY21 dividend record was A$3.58/share, comprising the stated interim and final dividends, with an 80% NPAT payout ratio stated by the company. |
| Safety / operating constraint | The FY21 report stated no fatalities and a rolling 12-month TRIFR of 2.0. COVID-19 controls continued; the company said COVID-19 had minimal operational impact in FY21. |
FY2022 — record hematite shipments; Iron Bridge construction progressed; FFI became a separate operating segment
| Evidence family | FY22 annual-report record |
|---|---|
| Reporting perimeter | The report disclosed Iron Ore and FFI as operating segments. Corporate cash, debt and tax were managed at Group level. |
| Pilbara operations | Shipments were a record 189.0mt wmt, compared with 182.2mt in FY21. Ore processed was 188.6mt and ore sold 188.6mt. The report attributed the shipment increase to Eliwana integration and planned output at existing operations. Eliwana operated at its designed 30mtpa output. Queens Valley output continued and the overland conveyor had commissioned in the first half; Bigge at Cloudbreak entered production in Q3. |
| Energy infrastructure | The FY22 report said all 809 Stage 1 PEC transmission poles were complete, conductors were strung and the line was tested/ready for energisation. Chichester Solar Gas Hybrid commissioning occurred in November 2021, replacing existing diesel generation for the rest of FY22. |
| Iron Bridge | The revised total project-capital estimate was US$3.6–3.8bn, of which Fortescue’s stated 69% share was US$2.7–2.9bn. The report recorded completion of Lumsden Point module offload, delivery of 20 of 21 module ships by 30 June, installation of primary crusher A, commencement of Dry Circuit A commissioning, 130km of pipeline welding and progress at the concentrate-handling facility. It also disclosed cost, supply-chain, COVID-19, labour and specialist-skills constraints as project risks. |
| International / Belinga | In December 2021 Fortescue entered an exclusivity agreement with the Government of Gabon to study development of the Belinga Iron Ore project. The FY22 report also listed drilling or exploration activities in Argentina, Kazakhstan, Peru, Chile, Brazil and Ecuador. |
| Energy/technology | The report recorded the GEM Centre agreement, a 60% HyET Group acquisition, WAE acquisition for US$219m (less US$9m acquired cash), battery-electric locomotive purchases, the Infinity Train study/development programme, and the Liebherr green-mining-haul-truck agreement. These were project, technology or agreement facts; they are not treated here as commercial-production outcomes. |
| Finance and distributions | Revenue was US$17,390m, underlying EBITDA US$10,561m and statutory NPAT US$6,197m. Cash generated from operations was US$10,515m; net operating cash flow US$6,646m; capex including joint operations US$3.074bn; free cash flow US$3.572bn. Fortescue issued US$700m 5.875% senior notes due 2030 and US$800m 6.125% green notes due 2032. Total FY22 dividends were A$2.07/share, with a stated 75% NPAT payout ratio. |
| Safety | The report recorded one fatality following an incident at Solomon Hub on 30 September 2021. Rolling 12-month TRIFR was 1.8 at 30 June 2022. |
FY2023 — Metals/Energy presentation; Iron Bridge concentrate commenced; Belinga ore reached rail
| Evidence family | FY23 annual-report record |
|---|---|
| Reporting perimeter | Fortescue reported Metals and Energy divisions. Fortescue WAE moved from Metals to Energy and FY22 segment comparatives were restated for the presentation change. |
| Pilbara operations | Pilbara hematite operations recorded 323mt overburden removed, 218mt mined, 192mt processed, 192mt shipped and 192mt sold. The report attributed the 1.5x strip ratio to ore/waste sequencing, development of new areas and annual/life-of-mine planning. Garden and Hall development continued in Chichester; Flying Fish development continued in the Western Hub. |
| Iron Bridge | High-grade magnetite concentrate production commenced in the final quarter of FY23. First concentrate loaded onto a ship on 24 July 2023, after the reporting date. The financial statements recognised a US$1,037m pre-tax impairment (US$726m after tax) for the Iron Bridge CGU, attributing it to inflationary operating costs, higher discount rates and timing of ramp-up. |
| Belinga / Gabon | In February 2023, Ivindo Iron SA signed a Mining Convention with Gabon. First ore was transported by rail to port in June 2023. The report said first shipment was targeted by the end of calendar 2023; it was an FY23 forward-looking statement, not an FY23 shipment result. Fortescue reported an indirect 72% interest in Ivindo Iron. |
| Energy / green technology | The Board-approved decarbonisation roadmap was reported as US$6.2bn and described a Real Zero goal for Scope 1 and 2 terrestrial emissions at Australian iron-ore operations by 2030. The annual report also recorded acquisition of the Phoenix Hydrogen Hub, project studies in Australia, Kenya, Norway and Brazil, construction completion at the Gladstone GEM Centre, technology-centre activity and the FY23 Energy reporting configuration. |
| Finance and distributions | Operating sales revenue was US$16,871m, underlying EBITDA US$9,963m and statutory NPAT US$4,796m. Total debt was US$5,321m, cash US$4,287m and net debt US$1,034m. Cash generated from operations was US$10,016m; net operating cash flow US$7,432m; capital expenditure/investments US$3.181bn; free cash flow US$4.251bn. The dividend record was A$0.75 interim and A$1.00 final, totaling A$1.75/share and stated as a 65% underlying-NPAT payout. |
FY2024 — Iron Bridge became an operating asset; first Belinga pilot shipment; recovery after derailment
| Evidence family | FY24 annual-report record |
|---|---|
| Group and operating system | The report described an integrated technology, energy and metals group. Iron Bridge transitioned from project to operational production in August 2023. First ore was reported from Flying Fish at Eliwana. |
| Pilbara operations | Shipments were 192mt, including a second-half record 97mt. The annual report described a recovery plan after an early-Q3 derailment and said supply-chain flexibility, value optimisation and product-portfolio refinement supported the FY24 shipment outcome. Hematite shipments were 190.4mt and Iron Bridge concentrate shipments 1.2mt. |
| Iron Bridge | The report recorded 13.0mt ore mined, 2.1mt concentrate produced and 1.2mt shipped on a 100% basis. It recorded first shipment of 67% Fe product in September 2023. The remuneration-performance record stated ramp-up to budget had not been achieved because of raw-water-pipeline performance, and referred to water banking and increased West Canning Basin water-licence arrangements. |
| Belinga / energy | The report recorded the first Belinga pilot-phase shipment—Fortescue’s first iron-ore export outside Australia. It also recorded North Star Junction solar construction/commissioning activity, Green Pioneer trials/certification, Energy/Zero developments and Green Metal work. |
| Finance and distributions | Operating sales revenue was US$18,220m, underlying EBITDA US$10,708m and statutory NPAT US$5,664m. Total debt was US$5,400m, cash US$4,903m and net debt US$497m. Cash generated from operations was US$10,689m, net operating cash flow US$7,919m, capex US$2.895bn and free cash flow US$5.108bn. The FY24 final dividend declared was A$0.89/share; together with the A$1.08 interim dividend, the stated final payout ratio was 70% within the policy range. |
| Safety | Fortescue Metals rolling 12-month TRIFR was 1.3. The report recorded zero fatalities for FY24. |
FY2025 — higher shipment record; Iron Bridge volume increased; Red Hawk acquired; Energy asset adjustments reported
| Evidence family | FY25 annual-report record |
|---|---|
| Pilbara operations | Total shipments and sales were each 198mt. Hematite shipments were 191mt and Iron Bridge magnetite shipments were 7mt, with Iron Bridge volumes stated on a 100% basis where specified. Hematite mining was 220mt and processing 195mt. The report recorded weather and logistics disruption during the year while stating that record rail volumes and processing supported shipments. |
| Iron Bridge | The report recorded 19mt mined, 7mt concentrate produced and 7mt shipped on a 100% basis. It stated FY26–FY28 production/shipment/nameplate milestones as management targets subject to process optimisation; those targets are not presented here as FY25 actual results. |
| Portfolio | Fortescue acquired 100% of Red Hawk Mining Ltd in March 2025 for A$254m excluding capitalised transaction costs. Its Blacksmith assets were identified for integration into the Life of Mine plan, while the FY25 resource statement included Blacksmith as an operating-property Mineral Resource only. The Solomon Tailings Storage Facility and Pipeline project was completed in FY25. |
| Power / technology | The FY25 report recorded commissioning of the first electric drill, expansion to seven electric excavators, a hydrogen fuel-cell battery-electric haul-truck prototype onsite, delivery of a battery-electric locomotive prototype, 460km of high-voltage infrastructure after 140km of construction, and North Star Junction solar commissioning. North Star was reported to have generated 180GWh and met 25% of Iron Bridge’s current electricity needs. |
| Finance and accounting | Operating sales revenue was US$15,541m, underlying EBITDA US$7,941m and statutory NPAT US$3,366m. The report recorded US$158m of one-off carrying-value adjustments in Energy assets, including PEM50, Gladstone automation-line and Arizona Hydrogen development costs. Total debt was US$5,439m, cash US$4,328m and net debt US$1,111m. Operating cash generation was US$8,267m, operating cash flow US$6,474m, capex including joint operations US$3.930bn and free cash flow US$2.555bn. |
| Distributions | The FY25 interim dividend was A$0.50/share. Directors declared an FY25 final dividend of A$0.60/share on 26 August 2025, described as 65% of NPAT and within the 50–80% policy. No FY25 shares were bought back under the on-market programme. |
Section sources
- Fortescue Metals Group Ltd FY21 Annual Report — Overview / operations, printed pp. 20–24; Operating and financial review—Production, financial performance, financial position, capital expenditure and exploration, printed pp. 25–42; Financial Report, printed pp. 73–77.
- Fortescue Metals Group Ltd FY22 Annual Report — Overview, printed pp. 22–24; Operating and financial review—Operations, FFI, Iron Bridge, Energy, exploration, debt, liquidity and dividends, printed pp. 28–47; Financial statements, printed pp. 82–134.
- Fortescue FY23 Annual Report — Overview, printed pp. 19–27; Operating and financial review—Metals, Energy, Iron Bridge, Belinga, financial performance and capital management, printed pp. 28–46; Financial Report, printed pp. 109–171.
- Fortescue FY24 Annual Report — Overview, printed pp. 2–26; Operating and financial review—Metals, Iron Bridge, Belinga, Energy, financial performance and capital management, printed pp. 27–43; Directors’ and Remuneration Report, printed pp. 102–149; Financial Report, printed pp. 150–224.
- Fortescue FY25 Annual Report — Overview, printed pp. 4–21; Operating and financial review—Operations, Iron Bridge, Red Hawk, financial performance, cash flow, capital expenditure and dividends, printed pp. 22–42; Ore Reserves and Mineral Resources, printed pp. 43–53; Financial Report, printed pp. 168–242.
03
3. Business system and complete portfolio-status map
This map is a report-derived index of named operations, infrastructure, development, exploration and technology items observed in the selected annual reports. Its classifications are descriptive only. “Operating”, “construction”, “study”, “development”, “exploration”, “technology” and “historical/reference” preserve the relevant report’s status; they are not assessments of quality, value or likely outcome.
Pilbara Metals system
| Item | Reported role / relation | Observed status across FY21–FY25 | Boundary notes |
|---|---|---|---|
| Chichester Hub | Pilbara operating hub comprising Cloudbreak and Christmas Creek. | Operating throughout. | Around 100mtpa capacity stated in FY22–FY25 overview material; do not assign group shipments to it. |
| Cloudbreak | Chichester mine/deposit and processing area. | Operating throughout. Bigge entered production in FY22; Garden and Hall development continued in FY23; Cloudbreak solar construction is discussed in FY24–FY25. | Cloudbreak and Christmas Creek resource/reserve tables remain separate where reported. |
| Christmas Creek | Chichester mine/deposit and processing area. | Operating throughout. WHIMS commissioned/ramped in FY21; solar-gas hybrid commissioned in FY22. | The later reports identify Christmas Creek as a Green Energy Hub / Green Metal Project location. |
| Solomon Hub | Pilbara hub containing Firetail, Kings Valley and Queens Valley in FY22–FY23 descriptions. | Operating throughout. | FY24/FY25 overview terminology groups Solomon with Eliwana in a broader Western Hub presentation; individual asset facts remain separately attributed. |
| Firetail | Solomon mine/deposit and blending source. | Operating throughout the selected period where described. | Listed with Kings/Queens in reserve/resource records; no unsupported mine-level production series is created here. |
| Kings Valley / Kings and Queens | Solomon mines/deposits. | Operating throughout; Queens development began production in FY21; Queens Valley expansion/overland conveyor appear in FY22. | “Kings and Queens” is a reported resource/reserve grouping and is not split unless source tables do so. |
| Western Hub / Eliwana | Hematite mine and dry-processing/rail development in the Western Hub. | Construction/commissioning in FY21; operating from December 2020 and at an annualised 30mt rate in FY22–FY23. | FY21 describes it as the Western Hub’s first mining area; later reporting associates it with Flying Fish. |
| Flying Fish | Deposit/development linked with Eliwana/Western Hub. | Development in FY23; first ore reported in FY24; included with Western Hub reserves/resources in later reports. | Do not conflate first ore with a separate mine-production figure absent in source. |
| Iron Bridge | Magnetite mine, processing system and joint operation. | Development/construction FY21–FY22; concentrate production began final quarter FY23; transitioned to operations August 2023; operating FY24–FY25. | 69% Fortescue / 31% Formosa Steel IB JV. 100% and Fortescue-share amounts remain separate. |
| North Star, Glacier Valley, West Star, South Star / Eastern Limb | Iron Bridge magnetite ore bodies/resource and reserve areas. | Resource/reserve and development context throughout; North Star/Glacier Valley are named in the project design. | A magnetite resource/reserve item is not a production figure. |
| Herb Elliott Port / Hedland Operations | Five-berth port and stockyard/load-out system at Port Hedland. | Operating throughout. | Licensed/approved throughput disclosed at up to 210mtpa; reported shipping volume remains group/system level. |
| Judith Street Harbour / towage | Port Hedland towage infrastructure. | Operating throughout in the logistics system. | Ten tugs are listed in FY25; do not treat tug availability as an ore-production metric. |
| Rail system / Hamersley rail link | Wholly owned heavy-haul railway connecting mines to port. | Operating throughout; 760km stated in FY22–FY25. | Eliwana’s 143km link is a component/connection, not a second group network. |
| Fortescue Ore Carriers / VLOCs | Ocean freight vessels. | Eight 260,000-tonne-capacity vessels described throughout later reports; VLOC refinancing in FY25. | Shipments carried by the vessels are not total Group shipments. |
| Fortescue Hive | Integrated operations/control centre in Perth. | Operating; Iron Bridge control added FY23; relocated in December 2024. | A control/coordination asset, not a mine. |
| Fortescue River Gas Pipeline / gas generation | Energy infrastructure named in FY21–FY22 programme descriptions. | Operating/associated infrastructure and project context as reported. | Distinct from renewable generation and PEC transmission. |
| Pilbara Energy Connect (PEC) | Transmission, generation and storage programme supporting Pilbara operations/Iron Bridge. | Construction FY21–FY22; successive development/commissioning packages FY23–FY25. | Plans, installed assets and targets require their own year/status labels. |
| North Star Junction solar / BESS | Iron Bridge-linked renewable generation/storage asset. | Construction/commissioning in FY24; 100MW solar commissioned in FY25. | FY25 annual report states 180GWh output and 25% of Iron Bridge’s current electricity needs. BESS status remains as separately stated. |
| Chichester Solar Gas Hybrid | Alinta-owned 60MW solar / 60km transmission project linked to Chichester. | Commissioned November 2021; operational thereafter as described. | It is Alinta-owned/operated, not represented as a wholly owned Fortescue solar asset. |
| Cloudbreak solar and transmission | Renewable-power development serving Chichester. | Planning/design FY24; construction began FY25. | The 190MW capacity and early-FY27 full-operation timing are company project statements, not FY25 operating output. |
| Eliwana / Flying Fish BESS and transmission | PEC-related renewable-power work packages. | Development/construction packages FY24–FY25. | Capacity, line lengths and timing are retained as reported plans/works, not operating results unless commissioned. |
Energy, technology and green-metal system
| Item | Reported role / relation | Observed status across FY21–FY25 | Boundary notes |
|---|---|---|---|
| Fortescue Future Industries (FFI) | Wholly owned green-energy/industry business established in FY21. | Separate FFI segment FY22; part of Energy from FY23. | FFI reporting cannot be retroactively treated as FY21 Metals activity. |
| Fortescue Energy | Energy division/business containing FFI, Hydrogen Systems and WAE in FY23; Energy segment in FY24–FY25. | Operating reporting/business perimeter from FY23. | Segment loss is not a project-level cost or a valuation conclusion. |
| Fortescue WAE / Fortescue Zero | Battery/electrification technology business acquired in FY22, renamed/reported later as Fortescue Zero activities. | Acquired FY22; reported within Energy from FY23; technology products/deployments reported FY24–FY25. | Technology development/manufacturing is distinct from Pilbara iron-ore operating metrics. |
| GEM Centre / Gladstone electrolyser facility | Green-energy manufacturing facility. | Agreement FY22; construction complete / fit-out FY23; carrying-value adjustment component disclosed FY25. | Completion of works/fit-out does not establish full commercial production. |
| Green Fleet Energy Hub | Christmas Creek hydrogen refuelling and related fleet infrastructure. | Green-bond allocation and project record FY23–FY25. | Project allocations are use-of-proceeds facts, not revenue. |
| Battery-electric locomotives / Infinity Train | Rail decarbonisation equipment and development programme. | Locomotives purchased FY22; dual-fuel ammonia locomotive testing FY23; battery-electric locomotive prototype arrived FY25. | Field trials/prototypes are not fleet-wide conversion. |
| Liebherr and XCMG equipment programmes | Mining-equipment development / supply agreements. | Agreements from FY22, further equipment/system developments FY25. | Delivery expectations and prototype activity are plans or reported milestones, not guaranteed outcomes. |
| Green Pioneer | Dual-fuel ammonia vessel. | Planned trials FY23; trials/certification described FY24; international ammonia-fuel passage described FY25. | Vessel activity is distinct from Fortescue’s ore-shipping fleet. |
| Green Metal Project, Christmas Creek | Lower-emission iron product project using hydrogen/electricity and Fortescue ore. | Reported project activity FY24–FY25. | FY25 production/timing statement is an anticipated project outcome, not an FY25 product volume. |
| Phoenix / Arizona Hydrogen | US green-hydrogen project/development activity. | Acquired FY23; Energy carrying-value adjustment includes Arizona initial development costs in FY25. | Project acquisition/development cost does not establish an operating hydrogen output. |
| Gibson Island, Nakuru, Holmaneset, Pecém | Green hydrogen/ammonia project proposals/studies. | Various study/FEED/pre-feasibility stages stated in FY23. | No FY23 FID is inferred from the listed stages. |
| HyET, Ionix, Sparc Hydrogen, Hydrogen Systems | Technology, acquisition or investment references. | FY22–FY25 portfolio/technology records. | Each requires its own reported ownership/status; no common production volume is inferred. |
Exploration, development and international register
| Item / area | Reported role | Observed status / event in selected reports | Boundary note |
|---|---|---|---|
| Belinga / Ivindo Iron, Gabon | International iron-ore development/exploration project. | Exclusivity agreement FY22; Mining Convention and rail-to-port first ore FY23; pilot first shipment FY24; feasibility/development activity FY25. | 72% Ivindo Iron interest reported FY23–FY24; stated potential is not a reserve or approved outcome. |
| Blacksmith / Red Hawk | Iron-ore resource/project portfolio addition. | Red Hawk acquired in March 2025; Blacksmith entered FY25 operating-property Mineral Resource disclosure. | Resource inclusion is not proof of mine operation. |
| Mindy South, Nyidinghu, White Knight, Wyloo North | Pilbara exploration/development areas. | Recurrent resource-definition/advanced exploration FY21–FY25. | Later resource or study work does not establish Ore Reserves unless stated in annual report tables. |
| Greater Chichester, Greater Solomon, Greater Western, Pilbara Other | Resource-reporting groupings. | Named development-property resource groups in FY21–FY25 resource sections. | Groupings contain multiple deposits; they are not operating hubs. |
| Investigator, Mount Lewin, Serenity, Queens East West/Sheila Valley, Mount MacLeod, Cerberus, Stingray, Raven, Flying Fish South, Vivash, Cobra, Lora, Zorb, Farquhar, Elevation, Boolgeeda CID, Fig Tree, Triton, Wonmunna, Panhandle, Earendil, Indabiddy, Prairie Heights, Yorick, McPhee Creek | Named deposit/prospect rows observed in development-property disclosures. | Resource/exploration register context; FY25 tables provide the widest selected named list. | Inclusion in this map does not imply a mine, reserve, ownership percentage or development approval unless separately reported. |
| Paterson / Isdell, Myall, Argentina, Chile, Brazil, Peru, Kazakhstan, Portugal, Canada and other named jurisdictions | Critical-minerals / regional exploration activity. | Various survey, drilling, tenement, farm-in or target-generation activities across FY21–FY25. | Geography and exploration activity are not mineral inventory or project valuation. |
Section sources
- Fortescue Metals Group Ltd FY21 Annual Report — Overview / operations and Iron Bridge, printed pp. 20–24; Operating and financial review—production, capital expenditure, energy and exploration, printed pp. 27–42; Ore Reserves and Mineral Resources, printed pp. 43–52.
- Fortescue Metals Group Ltd FY22 Annual Report — Overview—our operations, Iron Bridge and international footprint, printed pp. 22–24; Operating and financial review—operations, Iron Bridge, Energy and exploration, printed pp. 28–37; Ore Reserves and Mineral Resources, printed pp. 48–58.
- Fortescue FY23 Annual Report — Overview—operations, Iron Bridge, Energy and international work, printed pp. 19–27; Operating and financial review—Metals, Iron Bridge, Energy, Belinga and exploration, printed pp. 28–46; Ore Reserves and Mineral Resources, printed pp. 47–56.
- Fortescue FY24 Annual Report — Overview, printed pp. 2–26; Operating and financial review—Metals, exploration, Belinga, Energy and technology, printed pp. 27–43; Ore Reserves and Mineral Resources, printed pp. 44–54.
- Fortescue FY25 Annual Report — Overview, printed pp. 4–21; Operating and financial review—operations, Iron Bridge, Red Hawk, PEC, Green Metal, Energy and exploration, printed pp. 22–42; Ore Reserves and Mineral Resources, printed pp. 43–53; Financial Report, printed pp. 168–242.
05
5. Pilbara operating system: production, products, rail, port, gas and power
Fortescue's FY2021–FY2025 reports describe its hematite business as an integrated mine, processing, rail, port and shipping system. The annual production and shipment figures below are Pilbara hematite-system totals, not mine-by-mine allocations. The reports do not provide a five-year production or shipment series for each individual mine; no such allocation is made here.
| FY ended 30 June | Overburden removed | Ore mined | Ore processed | Hematite shipments | Ore sold | Reported operating context |
|---|---|---|---|---|---|---|
| 2021 | 295.2m wmt | 226.9m wmt | 185.8m wmt | 182.2m wmt | 181.1m wmt | Eliwana entered the operating system; Queens began feeding existing OPFs. |
| 2022 | 314.6m wmt | 228.8m wmt | 188.6m wmt | 189.0m wmt | 188.6m wmt | Record shipment result; Eliwana was reported at its designed 30mtpa rate. |
| 2023 | 323m wmt | 218m wmt | 192m wmt | 192m wmt | 192m wmt | Higher strip ratio of 1.5x was attributed to sequencing, new-area development and annual/LOM planning. |
| 2024 | 324m wmt | 204m wmt | 188m wmt | 190.4m wmt hematite | 191m t total sales | FY24 total shipment was 192Mt, including 1.2Mt Iron Bridge concentrate; a recovery plan followed an early-Q3 derailment. |
| 2025 | 341 Mt wmt | 220 Mt wmt | 195 Mt wmt | 191 Mt hematite shipments | 198 Mt total sales | Iron Bridge’s 7 Mt shipment is separately reported on a 100% basis; the report identifies the life-cycle stage of Chichester and Western Hub operations as relevant to hematite mining and processing volumes. |
Five-year operating and product record
- FY2021: Fortescue reported 182.2mt shipments and 181.1mt sold on a wet-metric-tonne basis. Ore mined rose by 23mt from FY2020; the report linked that increase to commissioning and transition of Eliwana. It reported a 1.3 strip ratio, 185.8mt processed, and lower reliance on ancillary crushing as Eliwana was integrated. Christmas Creek's wet high-intensity magnetic separation (WHIMS) plant, commissioned in December 2020, ramped to capacity in the second half and was described as improving yield and grade. West Pilbara Fines represented 9% of FY21 sales. FMG Trading Shanghai's cumulative sales from June 2019 to 30 June 2021 were 17.7mt; the report describes the entity as selling smaller volumes in RMB from regional Chinese ports and explains that shipment/sales differences could reflect inventory at those ports.
- FY2022: Shipment volume was 189.0mt, 6.8mt above FY2021 and described as a record. The report attributed the result to Eliwana integration and consistent planned output at existing operations. Ore processing was 188.6mt; Eliwana was said to have operated consistently at its designed 30mtpa output, existing OPFs operated reliably, and processing occurred without ancillary crushing, compared with 9.3mt of ancillary crushing in FY2021. WHIMS met target throughput. West Pilbara Fines sales were 15.0mt, compared with 17.0mt in FY2021. FMG Trading Shanghai sold 18.5mt.
- FY2023: The report recorded 192mt processed, 192mt shipped and 192mt sold across Pilbara hematite operations. It reported 218mt mined and a 1.5x strip ratio, compared with 229mt and 1.4x in FY2022; its stated causes were ore/waste sequencing, new-area development and alignment with annual and life-of-mine plans. It attributed the shipment result to planned production, stable operations and inventory in the value chain. FMG Trading Shanghai sold 16.7mt. The same year, Iron Bridge's 1.4mt mined ore was reported separately from the Pilbara hematite production/shipments table.
- FY2024: Total shipments were 192Mt, including 190.4Mt hematite and 1.2Mt Iron Bridge concentrate. Hematite mining was 204Mt, processing 188Mt and the strip ratio 1.6x. Fortescue attributed the strip-ratio increase to the life-cycle position of Chichester and Western Hub operations. The report states that an early-Q3 derailment was followed by a recovery plan using supply-chain flexibility, value optimisation and product-portfolio refinement; it reported a second-half shipment record of 97Mt. FMG Trading Shanghai sold 11.3Mt. Iron Bridge's 13.0Mt ore mined, 2.1Mt concentrate produced and 1.2Mt shipped are 100%-basis magnetite figures and remain separate from hematite C1 calculations.
- FY2025: The report recorded 341Mt wmt overburden removed, 220Mt wmt hematite ore mined, 195Mt wmt hematite ore processed, 191Mt hematite shipments and 198Mt total sales. Iron Bridge’s 7Mt shipment remains a separately reported 100%-basis magnetite figure. The report states that its operating hubs are coordinated with its product and marketing strategy and that hematite mining and processing volumes reflect the life-cycle stage of Chichester and Western Hub operations. The separate 198.4Mt climate disclosure is retained only in Section 15, where its Scope 3 reporting context is explicit.
Shared rail, port, shipping, gas and control infrastructure
- Rail and port: In FY2021 the annual report said Herb Elliott Port's licensed throughput approval had risen from 175mtpa to 210mtpa, including support for growth projects such as Iron Bridge. FY2023 described Fortescue as wholly owning and operating its rail and port facilities, with Herb Elliott Port having five operating berths and the same 210mtpa approval. FY2024 again reported 760km of rail, five port berths and 210mtpa port approvals. These are system-level figures; they are not attributed to individual hubs in this record.
- Shipping and towage: FY2023 identifies Judith Street Harbour towage infrastructure and tugs as part of the Port Hedland chain. It also reported that eight purpose-built Fortescue Ore Carriers, each with 260,000-tonne capacity, carried 18.9mt in FY2023 and accounted for about 10% of shipping requirements. FY2024 reported towage services within other revenue, but does not provide a mine-level relationship for that activity.
- Integrated control and automation: The FY2021 fleet included 193 autonomous haul trucks across the Solomon and Chichester hubs. The FY2023 report says more than 190 autonomous haul trucks were operating across those two hubs. The Fortescue Hive in Perth, opened in 2020, combined planning, operations, mine control, port, rail, shipping and marketing teams on a 24/7 basis; Iron Bridge control was added in FY2023. Automation and the Hive are reported as shared-system arrangements, not as a separate production stream.
- Gas and power: In FY2021, Pilbara Energy Connect (PEC) was described as a US$0.7bn programme comprising 275km of high-voltage transmission, 150MW gas generation, 150MW solar PV and large-scale battery storage. FY2022 reported extra gas-fired capacity at Solomon Power Station and completion of the first Solomon-to-Iron Bridge transmission stage. The same report describes the Alinta-owned Chichester Solar Gas Hybrid as a 60MW solar PV facility and 60km transmission line connecting Christmas Creek and Cloudbreak to Alinta's Newman gas-fired power station; it was commissioned in November 2021 and replaced existing diesel generation for the remainder of FY2022. The FY2023 report states that PEC and the Chichester Solar Gas Hybrid were designed to connect Port Hedland, Iron Bridge, Cloudbreak, Christmas Creek, Solomon and Eliwana through more than 500km of transmission lines. FY2024 records the initial PEC phase as a 100MW North Star Junction solar farm plus 500km of transmission lines/substations, while separately identifying planned lines, solar and battery packages for the hubs. These disclosed arrangements are included as infrastructure facts; the report does not quantify an annual gas or electricity allocation to each mine.
Section sources
- Fortescue FY21 Annual Report — Overview of operations, pp. 20–23; Operating and financial review: Production, marketing and innovation, pp. 27–30; Costs / production costs, pp. 30–40; Capital expenditure—Energy, pp. 41–42.
- Fortescue FY22 Annual Report — Operating and financial review: Operations and marketing/product strategy, pp. 30–31; Operating and financial review: Energy, p. 36; Eligible Project allocation/details, pp. 38–39.
- Fortescue FY23 Annual Report — Overview: Our operations, Hedland operations and Integrated Operations Centre, pp. 19–27; Operating and financial review: Fortescue Metals, pp. 28–46; Climate Change Report, pp. 65–69.
- Fortescue FY24 Annual Report — Overview: Metals, Integrated Operations and Renewable Power, pp. 2–26; Operating and Financial Review: Fortescue Metals, marketing/product strategy and production costs, pp. 27–43.
- Fortescue FY25 Annual Report — Operating and financial review: Operations, Chichester Hub, Western Hub and key operational metrics, pp. 22–42; Climate Change Report, pp. 57–90.
06
6. Chichester Hub: Cloudbreak and Christmas Creek
The annual reports identify the Chichester Hub as Cloudbreak and Christmas Creek in the Chichester Ranges. The reports also state that Cloudbreak and Christmas Creek are historically quoted separately in the reserve statement but are effectively one deposit for mining/processing purposes, with ore directed to the nearest of three ore-processing facilities. The five-year record therefore preserves both the individual asset names and the stated common-processing boundary.
Asset and operating chronology
- FY2021: Fortescue listed Cloudbreak and Christmas Creek as the Chichester Hub. It reported completion of the Chichester autonomous-haulage project in FY2021. Christmas Creek's WHIMS plant was commissioned in December 2020 and reached capacity during the second half of FY2021. The report says the system improved yield and grade. The 193-truck autonomous fleet was stated to operate across both the Solomon and Chichester hubs; a hub-specific truck count was not reported.
- FY2022: Bigge entered production at Cloudbreak in Q3 FY2022. The report describes Bigge as an expansion westward at Cloudbreak and a source of low-strip-ratio material. It also records that the Chichester Solar Gas Hybrid replaced the then-existing diesel generation for the balance of FY2022 following November 2021 commissioning. It does not publish a separate Cloudbreak or Christmas Creek annual production/shipments result.
- FY2023: The annual report describes Chichester as having about 100mtpa annual capacity across three OPFs. It records a 60MW solar farm supporting daytime Cloudbreak and Christmas Creek operations, stated to displace around 100 million litres of diesel annually. It describes 20km of relocatable conveyors at Cloudbreak, designed to be moved to new mining areas. Development work continued at Garden and Hall, with the stated aim of optimising system capacity while aligning with product strategy and managing operating and capital costs.
- FY2024: The annual report links the hematite strip ratio increase at the group level partly to the life-cycle stage of Chichester and Western Hub operations. It does not provide an independently identifiable Chichester production/shipments figure. In the reserve statement, the decrease in Chichester reserves was attributed primarily to depletion and reclassification of localised Indicated Resources to Inferred at Christmas Creek.
- FY2025: The report describes Cloudbreak and Christmas Creek as having around 100mtpa capacity across three OPFs and identifies Christmas Creek as the location of the Green Energy Hub and Green Metal Project. It reports a 60MW solar farm supporting daytime hub operations and says a 190MW Cloudbreak solar farm was under construction. The report separately describes construction of 110km of 220kV line/substation works for Cloudbreak and Christmas Creek and the Cloudbreak solar project; those energy works are company-reported construction/project facts, not FY2025 operating output.
Chichester reserve and resource record
| Reporting date | Chichester hematite Ore Reserve | Cloudbreak | Christmas Creek | Chichester hematite Mineral Resource / other record | Comparability and issuer-stated movement |
|---|---|---|---|---|---|
| 30 Jun 2021 | 1,294Mt product at 57.0% Fe | 533Mt at 57.2% Fe | 761Mt at 56.9% Fe | 2,379Mt at 56.3% Fe | Reserve decrease of 111Mt attributed to depletion, density review and more conservative metallurgical/reconciliation factors. |
| 30 Jun 2022 | 1,078Mt at 57.2% Fe | 389Mt at 57.3% Fe | 688Mt at 57.1% Fe | Not separately reproduced in the retained ledger for this section | Net reserve decrease of 216Mt attributed to depletion and more conservative metallurgical/reconciliation factors. |
| 30 Jun 2023 | 985Mt at 57.2% Fe | 361Mt at 57.3% Fe | 624Mt at 57.2% Fe | Not separately reproduced in the retained ledger for this section | 93Mt net decrease, primarily depletion. |
| 30 Jun 2024 | 830Mt at 57.3% Fe | 331Mt at 57.4% Fe | 499Mt at 57.3% Fe | Not separately reproduced in the retained ledger for this section | 155Mt net decrease, primarily depletion plus localised Christmas Creek Indicated-to-Inferred reclassification. |
| 30 Jun 2025 | 812Mt at 57.1% Fe | 284Mt at 57.0% Fe | 528Mt at 57.2% Fe | 1,921Mt at 56.7% Fe; 86% Measured/Indicated | Reserve down 18Mt, largely depletion; the report states approximately 72% was Proved. |
- These reserve values are the annual report's hematite Ore Reserve figures. They must not be added to Mineral Resources or to production. FY2021 uses stated product tonnes; the FY2025 annual statement identifies its operating hematite reserve as dry product. Differences in basis, reporting scope and estimate inputs remain attached to each annual disclosure.
- For FY2021 the annual statement says resources are inclusive of reserves, that the estimates use the JORC 2012 Code, and that the company performed peer review/audit work. For FY2022, the reserve update specifically named sale depletion, permanent-infrastructure and relevant-heritage exclusions, ore-loss/dilution updates based on mine history, OPF response updates, metallurgical testwork at Christmas Creek/Cloudbreak/Queens, mine-geometry re-optimisation and a revised mine plan. These are estimate-update inputs, not changes in mined output.
- FY2025 identifies continued near-mine exploration at Chichester, and lists Greater Chichester development resources of 829Mt at 57.0% Fe as a group record distinct from the operating Chichester resource. Investigator, White Knight and Mount Lewin are listed as Greater Chichester development deposits; they are retained as separately disclosed development-property names rather than added to Cloudbreak or Christmas Creek.
Environment, heritage and operating-boundary facts
- In FY2023 the annual report recorded 96% operational/beneficial water use at Cloudbreak/Christmas Creek against an at-least-80% target, and stated that site-specific water targets had been set at Chichester in FY2019. These are reported environmental performance/management figures and do not measure ore throughput.
- The FY2022 and FY2025 reserve-update descriptions include heritage-area exclusions. FY2025 also says heritage-significant areas are excluded where appropriate in the resource/reserve reporting. The reports do not provide a separate annual Chichester rehabilitation-volume series in the retained ledgers used for this section.
Section sources
- Fortescue FY21 Annual Report — Overview of operations, pp. 20–23; Operating and financial review: Production, pp. 27–28; Ore Reserves and Mineral Resources, pp. 43–52.
- Fortescue FY22 Annual Report — Operating and financial review: Operations and Energy, pp. 30–31, 36–37; Ore Reserves and Mineral Resources, pp. 48–58.
- Fortescue FY23 Annual Report — Overview: Chichester Hub and renewable power, pp. 19–27; Ore Reserves and Mineral Resources, pp. 47–56; Our approach to sustainability, pp. 57–61.
- Fortescue FY24 Annual Report — Overview: Metals, pp. 2–26; Operating and Financial Review, pp. 27–43; Ore Reserves and Mineral Resources, pp. 44–54.
- Fortescue FY25 Annual Report — Operating and financial review: Chichester Hub, decarbonisation and exploration, pp. 22–42; Ore Reserves and Mineral Resources, pp. 43–53; Climate Change Report, pp. 57–90.
07
7. Solomon Hub: Firetail and Kings Valley
Fortescue's FY2023 annual report identifies Solomon as comprising the Firetail, Kings Valley and Queens Valley mines in the Hamersley Ranges. It stated capacity of 65–70mtpa. The FY2024 and FY2025 reserve disclosures instead use a Western Hub grouping for Firetail, Kings and Queens, Eliwana and Flying Fish. This section keeps the Solomon mine names separate and does not relabel later Western Hub aggregates as Firetail or Kings Valley output.
Five-year chronology
- FY2021: Queens development commenced mining and provided feed to existing OPFs. The report stated that the autonomous fleet operated across Solomon and Chichester, and reported the group fleet as 193 autonomous haul trucks rather than a Solomon-specific number.
- FY2022: Queens Valley output continued and its overland conveyor was commissioned in the first half. At group level, the FY2022 operations record attributed part of the 1.9Mt increase in ore mined to Eliwana, Queens Valley output and Bigge; it does not state a standalone annual production figure for Firetail, Kings Valley or Queens Valley.
- FY2023: The report describes Firetail and Kings Valley/Queens Valley as Solomon's mines, and says Queens Valley expansion enabled continued Kings Fines production. Firetail's higher-grade ore was described as usable in blends with Eliwana and Chichester ore to make Fortescue Blend. In May 2023, a retrofitted dual-fuel ammonia locomotive was delivered to Solomon for field testing; the report identifies mainline trials as FY2024 work after commissioning. The FY2023 report also records more than 190 autonomous trucks operating across Solomon and Chichester.
- FY2024: The report no longer gives a stand-alone Solomon hub reserve total. Instead, Firetail, Kings and Queens, Eliwana and Flying Fish are included in a Western Hub aggregate. This is a reporting presentation change in the asset record; no mine-level production allocation is inferred.
- FY2025: The report states the Solomon Tailings Storage Facility and Pipeline project was completed in FY2025. It identifies continuing near-mine exploration at Solomon. It does not supply individual FY2025 Firetail or Kings Valley production/shipments figures in the retained annual ledger.
Reserve, resource and exploration record
| Reporting date | Solomon / Firetail / Kings-Queens Ore Reserve disclosure | Resource or estimate-update fact | Notes on grouping |
|---|---|---|---|
| 30 Jun 2021 | Solomon 567Mt product at 57.2% Fe: Firetail 66Mt at 59.3% Fe; Kings and Queens 501Mt at 56.9% Fe | Solomon operating hematite Mineral Resources 1,934Mt at 55.2% Fe | The report attributes a 64Mt reserve reduction mainly to depletion/density adjustments at Queens and updated metallurgical testwork. |
| 30 Jun 2022 | Solomon 682Mt at 56.9% Fe | Proved hematite reserves across Chichester/Solomon/Western increased to 1,018Mt from 937Mt; the report attributes the change to infill drilling at Solomon and Western Hub deposits. | The annual report attributes the Solomon increase of 115Mt primarily to higher revenue forecasts, improved resource tonnes/grades and pit-design modification. |
| 30 Jun 2023 | Solomon 668Mt at 56.9% Fe: Firetail 51Mt at 58.7% Fe; Kings/Queens 616Mt at 56.7% Fe | The reserve text records a 14Mt decline after depletion, resource additions and pit-design modifications. | Reported as a distinct Solomon group in FY2023. |
| 30 Jun 2024 | Not separately quoted; included in Western Hub's 871Mt at 57.4% Fe for Firetail, Kings and Queens, Eliwana and Flying Fish | Western aggregate declined 10Mt after depletion, resource changes, pit-design modification and heritage-significance-area exclusions. | No reverse allocation of the aggregate to Firetail or Kings/Queens. |
| 30 Jun 2025 | Not separately quoted; included in Western's 922Mt at 57.6% Fe for Firetail, Kings and Queens, Eliwana and Flying Fish | Greater Solomon development resources were 2,111Mt at 57.0% Fe, distinct from operating properties. | Greater Solomon names include Serenity, Queens East West (previously Sheila Valley), Mount MacLeod, Cerberus, Stingray and Raven. |
- FY2025's report-derived complete development-property list for Greater Solomon is Serenity, Queens East West (previously Sheila Valley), Mount MacLeod, Cerberus, Stingray and Raven. It is a development Mineral Resource group and is not added to the operating Firetail/Kings/Queens reserve or to mine production.
- FY2025 reports advanced exploration at Mindy South, Wyloo North and White Knight and continuing near-mine work at Solomon and Chichester. The stated focus was to convert resources to higher-confidence categories to support Ore Reserve conversion. This is a disclosed exploration objective, not an achieved conversion outcome for a specified Solomon mine.
- The annual reserve/resource statements state JORC 2012 classification, rounded tables and review/audit processes. For FY2025, the operating reserve update included sales depletion, exclusions for heritage/permanent infrastructure/tenements, revised ore loss and dilution based on life-of-mine operating history, metallurgical response, mine geometry and a revised LOM plan/product strategy. The report does not assign each factor to Firetail, Kings Valley or Queens Valley separately.
Section sources
- Fortescue FY21 Annual Report — Overview of operations, pp. 20–23; Operating and financial review: Production, pp. 27–28; Ore Reserves and Mineral Resources, pp. 43–52.
- Fortescue FY22 Annual Report — Operating and financial review: Operations, pp. 30–31; Ore Reserves and Mineral Resources, pp. 48–58.
- Fortescue FY23 Annual Report — Overview: Solomon Hub and zero-emission equipment, pp. 19–27; Operating and financial review: Fortescue Metals, pp. 28–46; Ore Reserves and Mineral Resources, pp. 47–56.
- Fortescue FY24 Annual Report — Overview: Metals, pp. 2–26; Ore Reserves and Mineral Resources, pp. 44–54.
- Fortescue FY25 Annual Report — Operating and financial review: Operations and critical minerals/iron ore exploration, pp. 22–42; Ore Reserves and Mineral Resources, pp. 43–53.
08
8. Western Hub and Eliwana
The report naming changes across the period are material to interpreting this section. FY2021 identifies Western Hub as the first mining area at Eliwana. FY2022 describes the Western Hub reserve as Eliwana and Flying Fish, which it says are effectively one deposit feeding the same dry OPF. FY2023 retains that definition. FY2024 and FY2025 expand the Western Hub reserve grouping to Firetail, Kings and Queens, Eliwana and Flying Fish. The tables below preserve those issuer-defined boundaries rather than reconstructing a consistent artificial mine series.
Construction, commissioning and operating chronology
- FY2021: First ore went through Eliwana's OPF in December 2020; the mine and rail transferred to the Operations team in January 2021. The mine spans more than 50km and includes a 143km rail link to Hamersley rail, a 30mtpa dry OPF, a low-profile OPF and dual stacker-reclaimer. The report states that the operation reached a 30mtpa annualised processing rate within six months. It described Eliwana as the Western Hub's first mining area and as a high-grade, low-strip-ratio dry-processing operation.
- FY2022: The report states that Eliwana operated consistently at its designed 30mtpa output. It identifies Western Hub resources as high-iron-content bedded ore that could add dry tonnes to the product suite. The FY2022 reserve narrative treats Eliwana and Flying Fish as effectively one deposit feeding the same dry-processing OPF.
- FY2023: Eliwana was reported as operating at a 30mt annualised rate, with its low-profile OPF and dual stacker-reclaimer able to direct-load up to 9,000 tonnes an hour. Development at Flying Fish continued. The Western Hub in the FY2023 reserve discussion consisted of Eliwana and Flying Fish.
- FY2024: The company reported first ore from Flying Fish. Its FY2024 reserve presentation grouped Firetail, Kings and Queens, Eliwana and Flying Fish in Western Hub. The group did not publish a separate FY2024 annual production or shipment value for Eliwana or Flying Fish.
- FY2025: The report describes Eliwana as commencing operations in 2020 and says Solomon and Eliwana, near the Hamersley Ranges, have a combined stated annual production capacity of around 100Mt. It identifies FY25 capital/investment categories including Flying Fish, Garden and Hall deposits, fleet replacement and PEC/Green Metal. These category disclosures do not supply project-by-project expenditure or production amounts. The FY2025 climate/energy record identifies a 120MWh Eliwana BESS as board-approved and reports 110km of 220kV line/substation construction for Cloudbreak/Christmas Creek; earlier FY2024 infrastructure disclosures separately identify approximately 140km of lines/substations to Eliwana and Flying Fish.
Western Hub and Eliwana reserve/resource record
| Reporting date | Issuer-defined Western/Eliwana reserve disclosure | Resource / update record | Comparability note |
|---|---|---|---|
| 30 Jun 2021 | Eliwana 221Mt product at 60.0% Fe | Operating hematite resources included Western Hub, including Flying Fish, within 5,367Mt at 56.3% Fe across Chichester, Solomon and Western; Flying Fish moved from development properties into operating Western Hub reporting. | FY2021 reports Eliwana as a separate reserve deposit while Flying Fish is moved into the Western Hub operating-resource presentation. |
| 30 Jun 2022 | Western Hub (Eliwana and Flying Fish) 227Mt at 60.1% Fe | Estimate update considered sales depletion, heritage/infrastructure exclusions, ore-loss/dilution after 12 months of mine history, processing response, mine geometry and revised plan/product strategy. | The report expressly treats Eliwana/Flying Fish as one deposit feeding the same dry OPF. |
| 30 Jun 2023 | Western Hub (Eliwana and Flying Fish) 213Mt at 59.4% Fe | 14Mt net reduction attributed to depletion and exclusion of heritage-management areas. | Same two-deposit grouping. |
| 30 Jun 2024 | Western Hub (Firetail, Kings and Queens, Eliwana and Flying Fish) 871Mt at 57.4% Fe | The group declined 10Mt after depletion, resource changes, pit-design modification and heritage-significance-area exclusions. | The expanded group cannot be compared as an Eliwana/Flying Fish-only series. |
| 30 Jun 2025 | Western Hub (Firetail, Kings and Queens, Eliwana and Flying Fish) 922Mt at 57.6% Fe; 63% Proved | Western Hub operating Mineral Resources 2,941Mt at 56.5% Fe; 70% Measured/Indicated. Greater Western development Mineral Resources 1,902Mt at 57.0% Fe. | The reserve rose 51Mt after depletion, higher Mineral Resource tonnes, pit-design changes and heritage-area exclusions. |
- FY2025's Greater Western development-property list is Flying Fish South, Vivash, Cobra, Lora, Zorb, Farquhar, Elevation, Boolgeeda CID and Wyloo North. These are report-listed development resources, separate from the operating-property Western Hub figures.
- FY2024 records Pilbara exploration focused on Mindy South, White Knight and Wyloo North, with near-mine exploration continuing at Solomon and Chichester. FY2025 records advanced work at Mindy South, Wyloo North and White Knight. The annual reports do not provide a separate FY2024 or FY2025 drilling-total record for Eliwana/Flying Fish in the retained ledgers.
- The FY2025 statement says the reserve update also addressed heritage, permanent-infrastructure and tenement exclusions, revised ore loss/dilution, metallurgical response, mine geometry and the LOM plan/product strategy. It reports that heritage-significant areas are excluded where appropriate. These are disclosed estimation boundaries and should not be converted to a mine-by-mine operating event without a direct asset attribution.
Section sources
- Fortescue FY21 Annual Report — Overview of operations, pp. 20–23; Operating and financial review: Production and capital expenditure—Eliwana, pp. 27–28, 40–41; Ore Reserves and Mineral Resources, pp. 43–52.
- Fortescue FY22 Annual Report — Operating and financial review: Operations and Exploration, pp. 30–31, 37; Ore Reserves and Mineral Resources, pp. 48–58.
- Fortescue FY23 Annual Report — Overview: Western Hub, pp. 19–27; Operating and financial review: Fortescue Metals, pp. 28–46; Ore Reserves and Mineral Resources, pp. 47–56.
- Fortescue FY24 Annual Report — Overview: Metals and Renewable Power, pp. 2–26; Operating and Financial Review, pp. 27–43; Ore Reserves and Mineral Resources, pp. 44–54.
- Fortescue FY25 Annual Report — Operating and financial review: Western Hub, operations, decarbonisation and exploration, pp. 22–42; Ore Reserves and Mineral Resources, pp. 43–53; Climate Change Report, pp. 57–90.
09
9. Iron Bridge magnetite — five-year delivery, commissioning and operating record
Reading boundary: project, operation and interest basis
Iron Bridge is Fortescue's magnetite operation about 145 km south of Port Hedland. It combines the North Star and Glacier Valley ore bodies with dry crushing and grinding, a 135 km concentrate slurry pipeline, a return-water pipeline and a Port Hedland concentrate-handling facility. It is not part of the hematite production/shipments series: where the annual report separately gives Iron Bridge production or shipments, the basis is stated below.
The asset is an unincorporated joint operation. In each of the selected annual reports, FMG Magnetite Pty Ltd is stated to hold 69% and Formosa Steel IB Pty Ltd 31%. Resource, reserve, mining, concentrate-production and shipment figures labelled 100% or JV basis below describe the whole Iron Bridge joint operation; they are not Fortescue-attributable figures. A 69% interest must not be applied unless the report itself presents the result on that basis.
FY2021 — construction assessment, revised capital and pre-production reserve baseline
- Actual project status: Iron Bridge was under construction, designed for 22 mtpa of low-impurity magnetite concentrate at a stated 67% Fe product grade. The report identified North Star and Glacier Valley as its ore bodies.
- Actual delivery work: the FY21 technical and commercial assessment addressed the concentrate and return-water pipelines, port/rail use, contractor strategy and modular-delivery logistics. The report records pipeline-corridor geotechnical work and construction of the Lumsden Point module-offload facility.
- Revised project estimate (not an actual cost): after the 12-week assessment, the company reported a completion-capital estimate of US$3.3–3.5bn. It reported Fortescue investment of US$1.2bn at 30 June 2021 and a joint-operation project-share range of US$2.5–2.7bn. These measures are differently described in the report and are not combined here.
- Schedule and ramp-up statement (not actual production): first production was then scheduled by December 2022, followed by an expected 12–18 month ramp-up to full run-rate.
- Operating-cost statement (not actual FY21 operating cost): the annual report gave estimated life-of-mine C1 cost of US$33–38/wmt, including port and power services, and stated sustaining capital of US$5–7/wmt.
- Ore Reserve at 30 June 2021 — 100% JV basis: 716 Mt dry in situ, 29.4% mass recovery, for a 67.0% Fe product. All reported reserve material was Probable; the report said no magnetite sales or production had yet occurred.
- Mineral Resource at 30 June 2021 — 100% basis: 5,448 Mt dry in situ at 22.7% DTR mass recovery: North Star/Eastern Limb 3,150 Mt, Glacier Valley 1,671 Mt, and West Star 627 Mt. The stated Fortescue entitlement was 69%.
- Qualification: the report described 2–3 Bt of reclassified material as an Exploration Target, not a Mineral Resource, and stated that insufficient exploration existed to estimate a Mineral Resource. It also identified a Cave 13 mining restriction and pending Glacier Valley mining approvals; the company stated at the time that neither was expected to materially affect reserves.
FY2022 — construction peak and dry-circuit commissioning
- Actual delivery work: the Lumsden Point module-offload facility was completed. By 30 June, 20 of 21 module ships had been unloaded and delivered; the remaining ship arrived in July 2022. Primary crusher A was installed, dry-circuit-A commissioning commenced from the primary crusher to the coarse-ore stockpile, 130 km of pipeline had been welded, and civil, structural and electrical work continued at the Port Hedland concentrate-handling facility.
- Actual construction conditions: the report listed industry cost pressures, global supply-chain constraints, COVID-19-related challenges, labour availability and specialist-skills access as factors affecting the construction period. These are company-disclosed delivery conditions, not a finding that any later schedule outcome necessarily resulted from one factor.
- Revised project estimate and schedule (not actual production): total capital was then estimated at US$3.6–3.8bn, with Fortescue's 69% share stated as US$2.7–2.9bn. Fortescue investment at 30 June 2022 was US$2.3bn. First production was then scheduled for the March 2023 quarter.
- Resource/reserve record: total magnetite Ore Reserves were 844 Mt dry in situ at 29.5% mass recovery for a 67.3% Fe product. Total magnetite Mineral Resources were 6.2 Bt dry in situ at 22.7% mass recovery. The annual report recorded a maiden South Star Mineral Resource of 898 Mt dry in situ.
- Technical reporting basis: the magnetite resource table used a 9% mass-recovery cut-off based on Davis Tube Recovery testwork, a US$200/t high-revenue-factor pit shell, dry in-situ tonnes and a resource figure inclusive of Ore Reserves. These are estimation/table conditions, not production measures.
FY2023 — first concentrate, post-year-end first shipment and impairment
- Actual project/operating event: the annual report said high-grade magnetite concentrate production commenced in the final quarter of FY2023. It recorded 1.4 Mt of ore mined during FY2023; this was not included in the report's Pilbara hematite production/shipments table.
- Post-balance-date event: the first concentrate was loaded onto a ship on 24 July 2023, after the 30 June 2023 reporting date. It is therefore not presented as an FY2023 shipment result. The Executive Chairman's message referred to a May 2023 launch and a maiden concentrate grade above 68%, against the company-stated 67% target; this remains management-reported project information.
- Project configuration: the report repeated the North Star/Glacier Valley system, wet concentrate and 135 km slurry-pipeline route to Port Hedland for dewatering/materials handling. Its stated full-capacity projection remained 22 mtpa of high-grade, low-impurity concentrate at 67% Fe.
- Accounting event: a US$1,037m pre-tax (US$726m after tax) impairment was recognised for the Iron Bridge cash-generating unit at 30 June 2023. The report attributed the assessment to inflationary operating costs, higher discount rates and ramp-up timing. This is an accounting event, not a cash-capex total or an operating-production measure.
- Ore Reserve at 30 June 2023 — 100% JV basis: 843 Mt dry in situ at 29.9% mass recovery for a 67.3% Fe product, all Probable. The report stated that full-scale production history and sales were absent at that reporting date. North Star/Eastern Limb: 640 Mt Probable, 30% mass recovery, 194 Mt product tonnes and 67.1% Fe; Glacier Valley: 203 Mt Probable, 29% mass recovery, 58 Mt product tonnes and 68.0% Fe.
- Access/approval qualification: mining within 100 m of the Pilbara leaf-nosed bat Cave 13 at North Star was prohibited pending regulatory demonstration. Glacier Valley primary environmental approvals were in progress with state and Commonwealth regulators. The report stated that its schedule included access delays and that it did not then expect either item to have a material reserve impact.
FY2024 — transition to operations, first product shipment and water-system constraint
- Actual status transition: Iron Bridge transitioned from project to operations in August 2023.
- Actual FY2024 physical record — 100% basis: 13.0 Mt ore mined, 2.1 Mt concentrate produced and 1.2 Mt shipped. The report recorded the first shipment of 67% Fe product in September 2023. These magnitudes are separate from the group hematite series.
- Actual ramp-up condition: the remuneration-performance record stated that ramp-up as per budget was not achieved because of raw-water-pipeline performance. The report described a water-banking strategy and commercial agreements to increase West Canning Basin water-abstraction licence. This is a reported operational condition, not a forecast of resolution.
- Ore Reserve / Mineral Resource at 30 June 2024 — 100% JV basis: magnetite Ore Reserve 832 Mt dry in situ, 29.9% mass recovery and 67.3% Fe product grade; magnetite Mineral Resources 6.198 Bt dry in situ at 23.1% average mass recovery.
- Accounting follow-up: no Iron Bridge CGU impairment indicators were identified in FY2024. The financial statements nevertheless identify judgement in price, foreign exchange, discount rate, recoverable resources, production, costs and capital in a recoverable-amount assessment. This does not reverse or net against the FY2023 impairment.
- Power/infrastructure linkage: the report links the initial Pilbara Energy Connect phase to Iron Bridge through the North Star Junction solar farm, transmission/substations and later BESS work packages. This is recorded as supporting infrastructure, not as a statement that a particular FY2024 Iron Bridge tonne was solar-powered.
FY2025 — operating throughput, distinct management targets and latest selected reserve/resource snapshot
- Actual FY2025 physical record — 100% basis: 19 Mt ore mined (FY2024: 13 Mt), 7 Mt concentrate produced (2 Mt) and 7 Mt shipped (1 Mt). The group reported the latter as Iron Bridge magnetite, separately from 191 Mt hematite shipments.
- Actual logistics configuration: the concentrate-handling facility received material through the 135 km slurry pipeline, dewatered it and stacked it at Hedland Operations; the annual report separately identified the return-water pipeline.
- Management outlook/targets, not FY2025 actuals: the company stated expected FY2026 shipments of 10–12 Mt on Fortescue's share basis, annualised Fortescue-share production of 16–20 Mt in H2 FY2027, and a 22 mtpa nameplate target in FY2028, subject to continuing process optimisation. They are not combined with 100%-basis FY2025 output and are not presented as MII forecasts.
- Ore Reserve at 30 June 2025 — 100% JV basis: 938 Mt dry in situ, 29.8% DTR mass recovery and 67.3% Fe product. The report states Fortescue's contractual share is 69%; it also says the estimate uses the current resource model, mining/geotechnical/metallurgical parameters and latest cost assumptions aligned to the proposed operating strategy.
- Mineral Resource at 30 June 2025 — 100% basis: 6.008 Bt dry in situ at 24.1% DTR mass recovery. This was lower than FY2024's 6.198 Bt. The report identified heritage exclusions at West Star and Glacier Valley, resource-model changes and an updated constraining pit shell. It records 2025 model updates for North Star, Eastern Limb, West Star and Glacier Valley; South Star had been updated in 2023.
- Accounting record: the external auditor treated Iron Bridge CGU impairment and restoration/rehabilitation obligations as key audit matters. Management identified impairment indicators, performed an assessment and recognised no impairment expense in FY2025. The audit description of FVLCD discounted cash flows lists inputs including prices, premiums, recoverable resources, production, costs, capital and closure; it is an accounting-estimate disclosure, not a valuation in this report.
Five-year project and resource ledger — do not add categories
| FY ended 30 June | Delivery / operating fact actually reported | Company target or estimate stated in that FY | Magnetite Ore Reserve — 100% basis | Magnetite Mineral Resource — 100% basis | Accounting / comparison note |
|---|---|---|---|---|---|
| 2021 | Construction; pipeline/geotechnical/module-offload work. | US$3.3–3.5bn completion estimate; first production by Dec-2022; 12–18 month ramp-up. | 716 Mt dry in situ; 29.4% recovery; 67.0% Fe product; all Probable. | 5,448 Mt; 22.7% DTR; North Star/Eastern Limb 3,150 Mt, Glacier Valley 1,671 Mt, West Star 627 Mt. | No production/sales; cave/approval qualifications stated. |
| 2022 | Module-offload completed; 20/21 module ships delivered; crusher A installed; dry-circuit-A commissioning; 130 km pipeline welded. | US$3.6–3.8bn total estimate; March-2023-quarter first-production schedule. | 844 Mt dry in situ; 29.5% recovery; 67.3% Fe product. | 6.2 Bt; 22.7% recovery; South Star maiden resource 898 Mt. | Resource table specifies cut-off/pit-shell/inclusive basis. |
| 2023 | Final-quarter concentrate production; 1.4 Mt ore mined. First ship loading occurred after year end. | 22 mtpa stated full-capacity projection. | 843 Mt dry in situ; 29.9% recovery; 67.3% Fe; all Probable. | 6.5 Bt; 22.7% recovery. | US$1,037m pre-tax / US$726m after-tax CGU impairment. |
| 2024 | Project transitioned to operations; 13.0 Mt mined, 2.1 Mt concentrate produced, 1.2 Mt shipped; first 67% Fe shipment Sep-2023. | 22 mtpa full-capacity objective. | 832 Mt dry in situ; 29.9% recovery; 67.3% Fe. | 6.198 Bt; 23.1% recovery. | Water-pipeline performance affected budget ramp-up; no CGU impairment indicators. |
| 2025 | 19 Mt mined, 7 Mt concentrate produced and 7 Mt shipped, all 100% basis. | FY26 10–12 Mt shipment expectation and H2 FY27 16–20 Mt annualised production, each Fortescue-share basis; FY28 22 mtpa target. | 938 Mt dry in situ; 29.8% DTR; 67.3% Fe. | 6.008 Bt; 24.1% DTR. | No impairment expense; resource change disclosed with heritage/model/pit-shell factors. |
The row-to-row figures are reported estimates on the annual-report basis shown. They should not be treated as a continuous production series, summed across years, converted to attributable tonnes unless the report does so, or used to infer a value.
Section sources
- Fortescue FY21 Annual Report — Overview, Iron Bridge Magnetite Project, pp. 22–23; Operating and financial review, Capital expenditure — Iron Bridge, pp. 41–42; Ore Reserves and Mineral Resources, pp. 47–52.
- Fortescue FY22 Annual Report — Overview, Iron Bridge Magnetite Project, p. 24; Operating and financial review, Iron Bridge, pp. 36–37; Ore Reserves and Mineral Resources, pp. 48–58.
- Fortescue FY23 Annual Report — Overview, Iron Bridge, pp. 19–27; Operating and financial review, Projects / Iron Bridge and Impairment expense, pp. 28–46; Ore Reserves and Mineral Resources, pp. 47–56.
- Fortescue FY24 Annual Report — Overview / Operating and financial review, Iron Bridge and operating record, pp. 2–43; Ore Reserves and Mineral Resources, pp. 44–54; Directors’/Remuneration Report, FY24 performance outcomes, pp. 102–149; Financial Report, Iron Bridge CGU, pp. 150–224.
- Fortescue FY25 Annual Report — Operating and financial review, Iron Bridge / operations, pp. 22–42; Ore Reserves and Mineral Resources, pp. 43–53; Financial Report / Independent auditor’s report, Iron Bridge impairment and rehabilitation, pp. 168–242.
10
10. Ore Reserves, Mineral Resources, exploration and complete named-asset register
Measurement rules and five-year totals
Fortescue reports its Ore Reserves and Mineral Resources under the 2012 JORC Code. The report family says values are rounded, resources are inclusive of reserves, and dry in-situ, dry-product, mass-recovery/DTR, grade, stockpile and ownership boundaries must be retained. Consequently, the figures below are presented as separate issuer measures. No MRE, Ore Reserve, inventory, production or exploration target is added to another category.
| FY ended 30 June | Hematite Ore Reserves | Hematite Mineral Resources | Magnetite Ore Reserves — Iron Bridge JV 100% basis | Magnetite Mineral Resources — 100% basis | Issuer-described comparison basis |
|---|---|---|---|---|---|
| 2021 | 2.082 Bt dry product at 57.4% Fe | 13.66 Bt dry in situ at 56.7% Fe | 716 Mt dry in situ; 29.4% mass recovery; 67.0% Fe product | 5.448 Bt at 22.7% DTR | First selected-year baseline; resources inclusive of reserves. |
| 2022 | 1.99 Bt dry product at 57.4% Fe | 13.55 Bt dry in situ at 56.8% Fe | 844 Mt; 29.5% recovery; 67.3% Fe product | 6.2 Bt at 22.7% recovery | 2022 table conditions include 9% DTR cut-off and pit-shell basis for magnetite resources. |
| 2023 | 1.87 Bt dry product at 57.4% Fe | 13.37 Bt dry in situ at 56.8% Fe | 843 Mt; 29.9% recovery; 67.3% Fe product | 6.5 Bt at 22.7% recovery | Hematite reserve review cites depletion, exclusions, metallurgical/geometry and LOM-plan changes. |
| 2024 | 1.701 Bt dry product at 57.4% Fe | 13.27 Bt dry in situ at 56.8% Fe | 832 Mt; 29.9% recovery; 67.3% Fe product | 6.198 Bt at 23.1% recovery | FY24 ledger does not make an asset-level MRE change comparable to every earlier deposit row. |
| 2025 | 1.734 Bt dry product at 57.4% Fe | 13.6 Bt dry in situ at 56.9% Fe | 938 Mt; 29.8% DTR; 67.3% Fe product | 6.008 Bt at 24.1% DTR | Magnetite resource movement attributed to stated heritage, model and pit-shell changes. |
Operating mines, hubs and producing/development deposits
| Named asset / family | Classification in the selected reports | Five-year record and stated measurement boundary |
|---|---|---|
| Chichester Hub | Operating hematite hub. | The reports group Cloudbreak and Christmas Creek in Chichester. FY21 Ore Reserve: 1,294 Mt at 57.0% Fe; FY22: 1,078 Mt at 57.2% Fe; FY23: 985 Mt at 57.2% Fe; FY24: 830 Mt at 57.3% Fe; FY25: 812 Mt at 57.1% Fe. These are hub-level dry-product reserve measures, not annual production. |
| Cloudbreak | Operating mine/deposit, Chichester Hub. | FY21 reserve 533 Mt at 57.2% Fe; FY22 389 Mt at 57.3% Fe; FY23 361 Mt at 57.3% Fe; FY24 331 Mt at 57.4% Fe; FY25 284 Mt at 57.0% Fe. The reports state Cloudbreak and Christmas Creek are historically quoted separately but effectively one deposit, with ore directed to the nearest of three OPFs. |
| Christmas Creek | Operating mine/deposit, Chichester Hub. | FY21 reserve 761 Mt at 56.9% Fe; FY22 688 Mt at 57.1% Fe; FY23 624 Mt at 57.2% Fe; FY24 499 Mt at 57.3% Fe; FY25 528 Mt at 57.2% Fe. FY24 commentary attributes the hub-level change partly to depletion and localised Indicated-to-Inferred reclassification at Christmas Creek. |
| Solomon Hub | Operating hematite hub, FY21–FY23 reporting family. | FY21 reserve 567 Mt at 57.2% Fe; FY22 682 Mt at 56.9% Fe; FY23 668 Mt at 56.9% Fe. FY24/FY25 reporting combines Firetail, Kings and Queens with Eliwana and Flying Fish under Western Hub; earlier Solomon totals must not be compared with this later combined boundary as though unchanged. |
| Firetail | Operating deposit/mine, initially Solomon and later included in Western Hub reserve disclosure. | FY21 reserve 66 Mt at 59.3% Fe; FY23 51 Mt at 58.7% Fe. FY24/FY25 ledgers identify Firetail within the combined Western Hub reserve but do not preserve a separate Firetail reserve figure in the retained ledger. not separately disclosed in the selected ledger is not zero. |
| Kings and Queens / Kings Valley / Queens development | Operating mine/deposit family, Solomon reporting. | FY21 table: Kings and Queens 501 Mt at 56.9% Fe; Queens development commenced mining in FY21 and fed existing OPFs. FY23: Kings/Queens 616 Mt at 56.7% Fe. The FY22/23 commentary states Solomon changes involved depletion, resource/grade changes and pit-design modification. A separate FY24/FY25 figure is not retained in the ledger; later disclosure is within Western Hub. |
| Western Hub | Operating/development hematite reporting family. | FY21 Eliwana reserve 221 Mt at 60.0% Fe; FY22 Eliwana/Flying Fish 227 Mt at 60.1% Fe; FY23 Eliwana/Flying Fish 213 Mt at 59.4% Fe. FY24 combined Firetail, Kings and Queens, Eliwana and Flying Fish: 871 Mt at 57.4% Fe. FY25 same later hub family: 922 Mt at 57.6% Fe. The changing composition is explicit. |
| Eliwana | Operating mine and dry-processing project, Western Hub. | First ore through the OPF was reported in Dec-2020; mine/rail moved to Operations in Jan-2021. FY21 reserve 221 Mt at 60.0% Fe; FY22–FY23 reported jointly with Flying Fish; FY24–FY25 within expanded Western Hub. FY21 report stated 30 mtpa dry OPF, 143 km rail link and 30 mtpa annualised processing rate within six months; these are asset configuration/milestone facts, not reserve additions. |
| Flying Fish / Flying Fish South | Western Hub deposit. | FY21 report moved Flying Fish from development-property to operating Western Hub reporting. FY22–FY23 it was paired with Eliwana in reserve reporting. FY24 recorded first ore from Flying Fish. FY25 lists Flying Fish South among Greater Western development-property resource names; it is not assumed to equal a separately reported Ore Reserve. |
| Blacksmith / Red Hawk | Operating-property Mineral Resource in FY25; acquired project/asset. | Fortescue acquired 100% of Red Hawk Mining Limited in March 2025. FY25 included Blacksmith as an operating-property Mineral Resource, 243 Mt at 59.3% Fe, 96% Measured/Indicated, across Delta, Eagle, Blackjack, Champion and Paragon. The selected FY25 record does not present Blacksmith as an Ore Reserve. |
Named operating-property magnetite deposits — Iron Bridge joint operation
| Named magnetite deposit | FY2021–FY2025 resource/reserve evidence | Status and qualification |
|---|---|---|
| North Star / Eastern Limb | FY21 MRE 3,150 Mt within the 5,448 Mt total. FY23 Ore Reserve: 640 Mt Probable, 30% mass recovery, 194 Mt product tonnes, 67.1% Fe. FY25 model update stated. | Iron Bridge JV; resource/reserve table scope is 100% basis. Cave 13 access constraint recorded FY21/FY23. |
| Glacier Valley | FY21 MRE 1,671 Mt. FY23 Ore Reserve: 203 Mt Probable, 29% mass recovery, 58 Mt product tonnes, 68.0% Fe. FY25 model update stated. | Iron Bridge JV; Glacier Valley environmental approval was in progress in FY21/FY23 record. |
| West Star | FY21 MRE 627 Mt. FY22/25 magnetite-resource tables list West Star. FY25 resource commentary identifies heritage exclusions and model updates. | MRE only in the retained section ledger; it must not be converted to a reserve. |
| South Star | FY22 maiden MRE 898 Mt dry in situ. FY23 report states South Star was updated in 2023. | MRE disclosure; no Ore Reserve is inferred. |
| Iron Bridge / IBJV aggregate | Annual total Ore Reserves: 716 Mt (FY21), 844 Mt (FY22), 843 Mt (FY23), 832 Mt (FY24), 938 Mt (FY25). Annual total MRE: 5.448 Bt, 6.2 Bt, 6.5 Bt, 6.198 Bt and 6.008 Bt respectively, on the annual basis stated above. | All total reserve figures are 100% JV scope; Fortescue share stated at 69%. |
Development-property and regional hematite register — names found in the selected annual ledgers
The names below are a completeness register, not a claim that every item was a producing mine or an Ore Reserve in every year. Where the selected ledgers supply a group rather than an item-level number, the group is retained and the individual asset is marked without an invented balance.
| Reporting family | Named deposits / prospects found | Reported five-year facts and boundary |
|---|---|---|
| Greater Chichester | Investigator; White Knight; Mount Lewin. | FY21 development MRE group: 433 Mt. FY25 development MRE group: 829 Mt. White Knight was named in FY24–FY25 exploration; FY25 says White Knight update contributed to development-resource changes. No individual FY25 MRE is supplied in the retained ledger. |
| Greater Solomon | Serenity; Queens East West (previously Sheila Valley); Mount MacLeod; Cerberus; Stingray; Raven. | FY21 group MRE 2,682 Mt; FY25 group 2,111 Mt. The 2025 names are retained as the development-property list; individual tonnes/grades are not assigned in this section because the selected ledger preserves the group measure. |
| Greater Western | Flying Fish South; Vivash; Cobra; Lora; Zorb; Farquhar; Elevation; Boolgeeda CID; Wyloo North. | FY21 group MRE 1,968 Mt; FY25 group 1,902 Mt. Wyloo North was named in FY23–FY25 exploration and FY25 update commentary. Individual balances are not disclosed in the ledger. |
| Nyidinghu | Nyidinghu. | FY21 study activity; FY22 resource-definition drilling; FY23 Eastern Hamersley resource-definition drilling; FY24 reserve commentary identifies it as brownfield/near-mine/greenfield opportunity not included in reserve unless study level appropriate; FY25 development MRE group was 2,306 Mt. The group total is not an item-level Nyidinghu number. |
| Pilbara Other | Fig Tree; Mindy South; Triton; Wonmunna; Panhandle; Earendil; Indabiddy; Prairie Heights; Yorick; McPhee Creek. | FY21 group MRE 738 Mt, including stated Mindy South addition and Wonmunna update. FY25 group MRE 1,623 Mt. FY25 update commentary names Mindy South classification and a new Yorick estimate. Individual MRE/reserve values are not supplied here. |
| Garden and Hall | Garden; Hall. | FY25 capital/investment categories list Flying Fish, Garden and Hall deposits. Their individual reserve/resource balance is not disclosed in the selected FY25 ledger, so it is not treated as zero or attributed to another asset. |
Exploration, international and other named projects/sites register
| Name / geography | Selected-report evidence and status | Measurement / comparison qualifier |
|---|---|---|
| Belinga, Gabon | FY22 exclusivity agreement to study development; FY23 convention with Gabon and first ore transported by rail in June 2023, with first shipment by end-2023 then stated as a target; FY24 first pilot-phase shipment and first Fortescue iron-ore export outside Australia; FY25 drilling >108,000 m RC and >12,000 m diamond core, 72% Fortescue interest in Ivindo Iron SA. | The reports describe potential/continuing studies and exploration; no reserve or MRE is invented. |
| Mindy South | FY21 strategic adjacent tenement acquired; mapping/drilling prioritised for FY22. Named in FY22–FY25 Pilbara work and FY25 resource-classification update. | A prospect/development-property name; group MRE only where shown above. |
| White Knight | Named in FY23–FY25 Pilbara exploration and FY25 development-resource update. | No individual MRE/reserve figure retained. |
| Wyloo North | Named in FY23–FY25 Western Hub/Pilbara exploration and FY25 development-resource update. | No individual MRE/reserve figure retained. |
| Eastern Hamersley | FY21–FY23 target/resource-definition drilling region, including Mindy South and Nyidinghu. | Regional exploration family, not a reported reserve. |
| Paterson / Rudall, WA | FY21–FY22 copper-gold survey/mapping/soil-sampling work. | Exploration activity; no mineral inventory stated in selected ledgers. |
| Isdell, Paterson Province | FY23 copper-gold drilling. | Exploration activity; no mineral inventory stated. |
| Arcoona, South Australia | FY21 follow-up drilling planning after initial work. | Exploration activity; no mineral inventory stated. |
| Cañariaco, Peru / Alta Copper or Candente stake | FY22 report records 19% Candente interest and Cañariaco advancement; FY23 records 25.4% Alta Copper stake and support for Cañariaco. | Corporate interest/project reference; stake percentages are report-year-specific and not treated as a single uninterrupted ownership series. |
| Argentina; Chile; Brazil; Kazakhstan; Ecuador; Colombia; Peru; Portugal; Canada; Queensland; New South Wales | Named across FY21–FY25 as drilling, target generation, pegged tenements, opportunities or broader exploration locations for copper-gold, critical minerals, lithium or rare earths. | Location/portfolio references; no resource/reserve or project maturity is inferred without a disclosed figure. |
| Myall, NSW | FY24 Magmatic Resources farm-in/JV, with Fortescue acquiring 19.9% of Magmatic. | Equity/project relationship stated for FY24; not a Fortescue-controlled Ore Reserve. |
| North Star Junction | Named in FY23–FY25 as solar/transmission/BESS infrastructure linked to Iron Bridge and Pilbara power; FY25 100 MW solar farm commissioned and reported to generate 180 GWh. | Energy infrastructure, not a mineral deposit or resource. |
| Lumsden Point / Port Hedland Concentrate Handling Facility | FY21–FY22 Iron Bridge module logistics and concentrate-handling construction; FY25 receives/dewaters/stacks concentrate at Hedland Operations. | Logistics/infrastructure asset; no mineral inventory. |
Completeness and non-comparability notes
- The register preserves every named mine, hub, deposit, prospect, project, infrastructure site and international exploration location found in the selected annual ledgers for this report section. A later change in hub aggregation—especially the move from a separate Solomon group to a broader Western Hub reserve group—is not silently normalised.
- A group resource number is not an individual-deposit number. Where the retained annual ledger gives only a group measure, the individual name is retained but marked as not separately disclosed.
- Iron Bridge's 100% joint-operation MRE/OR, 69% contractual interest, 100%-basis operating tonnes and Fortescue-share outlook all remain separate. No figure in this section is a valuation, a production forecast or an investment recommendation.
- Exploration Targets, potential scale/grade statements, work programmes and project studies remain distinct from Mineral Resources, Ore Reserves and approved operations.
Section sources
- Fortescue FY21 Annual Report — Operating and financial review, Production / Exploration, pp. 25–42; Ore Reserves and Mineral Resources, pp. 43–52; Overview, Iron Bridge / operating assets, pp. 20–23.
- Fortescue FY22 Annual Report — Overview, Iron Bridge and international footprint, p. 24; Operating and financial review, Exploration, p. 37; Ore Reserves and Mineral Resources, pp. 48–58, including operating-property hematite/magnetite and development-property tables.
- Fortescue FY23 Annual Report — Overview, Iron Bridge / Belinga, pp. 19–27; Operating and financial review, Projects / Exploration, pp. 28–46; Ore Reserves and Mineral Resources, pp. 47–56.
- Fortescue FY24 Annual Report — Overview, Metals / Belinga / exploration, pp. 2–26; Operating and financial review, Metals projects; critical minerals and iron-ore exploration, pp. 27–43; Ore Reserves and Mineral Resources, pp. 44–54.
- Fortescue FY25 Annual Report — Operating and financial review, Operations; Iron Bridge; critical minerals and iron-ore exploration; Belinga, pp. 22–42; Ore Reserves and Mineral Resources, pp. 43–53.
11
11. Decarbonisation of Pilbara metals operations
Reporting boundary and reading rule
This section records the annual-report evidence for decarbonising Fortescue's Australian terrestrial iron-ore operations and the associated Pilbara power, transmission and mobile-equipment programme. It does not treat a target, capacity design, avoided-emissions estimate, prototype, Board approval or guidance as an achieved operating result. Fortescue's FY2021 language was a 2030 carbon-neutrality target; later reports describe the Australian-terrestrial Scope 1 and 2 objective as Real Zero, defined in FY2024 as no fossil fuels and no offsets. The change in terminology is preserved rather than normalised backward.
FY2021 — initial programme, early construction and reported emissions
- In March 2021 Fortescue announced a 2030 carbon-neutrality target. The FY2021 report described this as net Scope 1 and Scope 2 emissions from existing and future operations falling to zero by 2030; it was a target, not a reported FY2021 outcome.
- Pilbara Energy Connect (PEC) was disclosed as a US$0.7bn programme: US$250m for 275km of high-voltage transmission and US$450m for 150MW of gas generation, 150MW of solar PV and large-scale battery storage. At 30 June 2021, bulk earthworks at Solomon Power Station and more than 660 of 800 transmission foundations were complete. The report stated that PEC could provide 25% of stationary mining energy through solar power; this was a programme description, not a measured FY2021 supply result.
- The Alinta-owned Chichester Solar Gas Hybrid was described as 60MW of solar PV and a 60km transmission line connecting Christmas Creek and Cloudbreak to Newman gas power. The FY2021 report said energisation was due in the second quarter of FY2022 and that the system was expected to displace about 100 million litres of diesel a year.
- The FY2021 report recorded work on ammonia locomotive fuel combustion, a marine-engine combustion-test device/pilot, in-principle approval for an ammonia-fuelled ore-carrier design, haul-truck battery-cell testing, hydrogen haul-truck and drill-rig demonstrations, and systems testing. These were technology-development or demonstration items, not fleet-wide operating conversion.
- FY2021 gross operational emissions were 2.22MtCO2-e, comprising 2.06Mt Scope 1 and 0.16Mt Scope 2. The report said offsets reduced net operational emissions to 2.01MtCO2-e, 3% below the FY2020 operational baseline. It identified policy/regulatory, technology-viability, demand and reputational transition risks as well as acute and chronic physical risks.
FY2022 — PEC completion steps, solar commissioning and early fleet infrastructure
- FY2022 PEC capital expenditure was US$187m, taking programme-to-date spending to US$462m. The report recorded additional gas-fired capacity under construction at Solomon Power Station and completion of the first Solomon-to-Iron Bridge transmission stage.
- At 30 June 2022, all 809 Stage 1 PEC transmission poles had been installed, conductors strung and the line tested and ready for energisation. The report still described the overall programme as US$700m, comprising the 275km transmission and generation components stated in FY2021.
- The Alinta-operated Chichester Solar Gas Hybrid was commissioned in November 2021 and replaced existing diesel generation for the remainder of FY2022. Fortescue said PEC plus that project were expected to source 25% of stationary energy requirements from solar; this is an expected share, not a disclosed FY2022 measured share.
- Green-bond allocations at 30 June 2022 included US$20m for Pilbara Generation, US$51m for Pilbara Transmission, US$24m for the Green Fleet Energy Hub and US$5m for battery-electric locomotives. The Green Fleet Energy Hub was defined as a 1.5MW hydrogen-refuelling station at Christmas Creek for ten hydrogen passenger coaches and associated infrastructure.
- Fortescue purchased two battery-electric locomotives from Progress Rail in January 2022, with delivery stated for 2023. It also announced the Infinity Train study in March 2022: a regenerating battery-electric iron-ore train proposed to recharge through gravitational energy on the return trip. The report estimated US$50m of study and development work over the next two years; it did not report a completed operational train in FY2022.
- FY2022 gross operational emissions were reported as 2.55MtCO2-e, including 1.90Mt Scope 1 and 0.33Mt Scope 2 in the cited climate disclosure. The report stated that renewable electricity from the Chichester project reduced electricity emissions intensity from 3.50 to 3.32. Gross Scope 3 emissions were 255MtCO2-e. Fortescue said it procured and surrendered offsets so that net operational emissions were 2.28MtCO2-e, 3% below the FY2020 baseline.
FY2023 — Real Zero roadmap, network expansion and prototype delivery
- Fortescue disclosed a Board-approved US$6.2bn decarbonisation roadmap seeking Real Zero by 2030: elimination of fossil-fuel use and Scope 1 and 2 terrestrial emissions at Australian iron-ore operations. The stated programme included an additional 2–3GW of renewable generation and battery storage, plus green-fleet and locomotive costs. The amount and scope were roadmap statements, not FY2023 spend or achieved emissions reduction.
- The company reported that it had identified solutions for about 90% of Australian terrestrial Scope 1 and 2 emissions and was continuing work on the remaining approximately 10%. It said voluntary Scope 1 and 2 offset purchases would cease from FY2024 unless required by law.
- FY2023 milestones included delivery of the first on-site battery-electric haul-truck prototype to Christmas Creek, continued hydrogen-haul-truck refinement, ammonia-locomotive deployment and modification of a diesel ship engine for ammonia operation. The annual report distinguishes these delivered or modified items from future field and sea trials.
- PEC and the Chichester solar project were described as targeting 25% of stationary-energy requirements from solar by FY2025. The network design connected Port Hedland, Iron Bridge, Cloudbreak, Christmas Creek, Solomon and Eliwana through more than 500km of transmission.
- FY2023 programme events were the construction of the 98km North Star Junction–Port Hedland transmission line and 220kV substation; construction of the 100MW North Star solar plant; Board approval for the 132km Solomon–Eliwana line and substation; and Board approval plus procurement for the 111km Lambda–Cloudbreak/Christmas Creek connection and two substations.
- Gross Scope 1 and 2 emissions were 2.55MtCO2-e in FY2023, split between 2.20Mt Scope 1 and 0.35Mt Scope 2. The stated operational-control boundary included Australian iron-ore operations, eight ore carriers and nine Port Hedland tugboats. The report listed 633 million litres of diesel and 4.1PJ of gas consumption, 145.7GWh renewable electricity purchased and 567GWh non-renewable electricity purchased.
- Fortescue reported surrendering 336,833tCO2-e of offsets in FY2023 to meet the preceding 3% annual net-emissions-reduction commitment, before stating that this approach would be replaced by spending toward the Real Zero pathway from FY2024. Its net-zero Scope 3 by 2040 and controlled-marine-vessel-emissions-by-2030 statements remained targets.
FY2024 — solar construction/commissioning, electric equipment and implementation constraints
- The FY2024 report continued to state a Real Zero target for Scope 1 and 2 terrestrial emissions from Australian iron-ore operations by 2030, defining it as no fossil fuels and no offsets. It said solutions had been identified for approximately 90% of those emissions and referred to a further 2–3GW of renewable generation/storage, a green mining fleet and locomotives as programme components.
- Reported FY2024 decarbonisation capital expenditure was US$224m, including PEC. North Star Junction's 100MW solar facility commenced construction/commissioning in the year. The report said that, when fully commissioned, the facility was expected to avoid up to 125,000tCO2-e a year; this is a company estimate rather than a FY2024 measured avoidance result.
- Fortescue reported Australia's first operational electric excavator at Cloudbreak, with three 400-tonne electric excavators in operation—two at Solomon and one at Cloudbreak. It reported that the Roadrunner 240-tonne battery-electric haul-truck prototype completed its first battery-power-system test phase and that the fast-charger prototype was commissioned on site and transferred 3MW to Roadrunner.
- The Europa hydrogen fuel-cell battery-electric haul-truck prototype was reported as developed and commissioned with Liebherr. The cited configuration was a T 264 truck with a Fortescue Zero battery, 500kW fuel cells and storage capacity of more than 380kg of liquid hydrogen. The report also recorded commissioning of a hydrogen-powered prototype offboard power unit for a retrofitted Liebherr electric excavator, onsite commissioning of an ammonia-powered locomotive with mainline testing under way, and DNV Class-approved KTA50 marine-engine land-test validation.
- Christmas Creek's gaseous/liquid hydrogen plant was described as able to produce about 530kg of hydrogen gas a day for fuel-cell coaches and prototype refuelling. This is a described plant capability rather than a reported annual hydrogen-production total.
- The annual report expressly identified implementation constraints: existing technologies require adaptation, new technologies must be developed, and technology and supply-chain availability/maturity remained material issues.
- FY2024 Australian terrestrial iron-ore Scope 1 and 2 emissions were 2.38MtCO2-e, compared with 2.28MtCO2-e in FY2023 and 2.23MtCO2-e in FY2022 in the sustainability disclosure. This is a reported emissions series; it is not presented as a measure of programme completion.
FY2025 — operating solar output, power-network work and reported emissions
- FY2025 decarbonisation capex was US$405m. Guidance of US$900m–US$1,200m for FY2026 and expected FY2026 cumulative investment of US$1.5bn–US$1.7bn in Australian mining decarbonisation are forward-looking company guidance, not FY2025 completed expenditure.
- Fortescue reported commissioning its first electric drill and expanding its electric-excavator fleet to seven. It signed a Liebherr equipment partnership for zero-emission machines including T 264 battery haul trucks designed to integrate Fortescue Zero power systems, and an XCMG agreement for zero-emission heavy mobile equipment. It also reported launch of a Liebherr co-developed autonomous-haulage system, onsite commissioning of a hydrogen fuel-cell battery-electric haul-truck prototype and arrival of a battery-electric locomotive prototype in the Pilbara.
- The company said 140km of high-voltage-line construction during FY2025 brought high-voltage infrastructure to 460km. Through PEC, 110km of 220kV line/substation construction was under way for Cloudbreak and Christmas Creek. Early design/procurement covered about 60km to future wind farms, approximately 130MW of wind generation, the 190MW Cloudbreak solar farm, a 250MWh North Star Junction battery energy-storage system and a 120MWh Eliwana battery energy-storage system.
- The 100MW North Star Junction solar farm was commissioned in FY2025. Fortescue reported 180GWh generated and said it met 25% of Iron Bridge's current electricity needs. Construction started on the 190MW Cloudbreak solar farm; the cited early-FY2027 full-operation timing is anticipated timing, not a FY2025 commissioning result. The Board approved large-scale BESS investment at North Star Junction and Eliwana.
- Location-based Scope 1 and 2 emissions from Australian terrestrial iron-ore operations were 2.66MtCO2-e: 2.29Mt Scope 1 and 0.37Mt Scope 2. Fortescue attributed the year-on-year increase from 2.38MtCO2-e to its transition plan and said energy-efficiency initiatives limited the increase to 11.6%, about 5% below budgeted emissions. These are issuer explanations and measurements, not a conclusion about future emissions.
- The FY2025 report stated that voluntary Scope 1 and 2 offsets had ceased in 2023, with credits used only where legislatively required. It expected about 240,000tCO2-e above Safeguard Mechanism baselines in FY2025, and stated that Christmas Creek and Eliwana had received FY2024–FY2028 multi-year monitoring periods during FY2025.
- The current stated targets remained: eliminate Scope 1 and 2 emissions from Australian terrestrial Pilbara iron-ore operations by 2030; enable a 7.5% reduction in steelmaking emissions intensity by 2030 from the FY2021 baseline; enable a 50% reduction in shipping-emissions intensity by 2030 from the FY2021 baseline; and net-zero Scope 3 by 2040. The report labels these as targets.
Five-year operating transition register
| Item | FY2021 | FY2022 | FY2023 | FY2024 | FY2025 |
|---|---|---|---|---|---|
| PEC transmission/power | US$700m programme; foundations and Solomon earthworks under way | Stage 1 poles/conductors complete and line ready for energisation | North Star–Port Hedland line/substation built; further lines approved | Initial phase described with North Star solar and subsequent work packages | 460km high-voltage infrastructure; Cloudbreak/Christmas Creek work under way |
| Chichester solar-gas hybrid | 60MW/60km project; energisation expected in Q2 FY22 | Commissioned November 2021 | Included in stationary-solar target | Referenced as the 60MW facility commissioned in 2021 | Existing facility remains part of the reported power system |
| North Star Junction solar | Not disclosed as operating asset | Not disclosed as operating asset | 100MW plant under construction | Construction/commissioning stated | 100MW commissioned; 180GWh generation reported |
| Mobile/rail conversion | Testing and demonstrations | Two battery-electric locomotives purchased for 2023 delivery; Infinity Train study | Battery-electric haul-truck prototype delivered; ammonia locomotive deployment | Electric excavators, Roadrunner/Europa prototypes and prototype power systems reported | Electric drill, seven excavators, haul-truck/locomotive prototypes and supplier agreements reported |
| Scope 1 and 2 reporting | 2.22MtCO2-e gross operational emissions | 2.55MtCO2-e gross operational emissions | 2.55MtCO2-e gross Scope 1/2 | 2.38MtCO2-e Australian terrestrial iron-ore emissions | 2.66MtCO2-e Australian terrestrial iron-ore location-based emissions |
Section sources
- Fortescue Metals Group FY2021 Annual Report — Operating and financial review: Climate change and capital expenditure—Energy, pp. 30, 37, 41–42; Our approach to climate change, pp. 61–64.
- Fortescue FY2022 Annual Report — Overview: Energy infrastructure, p. 24; Operating and financial review: Energy and eligible-project allocation, pp. 36–39; Climate Action, pp. 68–70.
- Fortescue FY2023 Annual Report — Overview: Decarbonisation, zero-emission equipment and renewable power, pp. 19–27; Operating and financial review: Decarbonisation, pp. 28–46; Our approach to climate change, pp. 65–69.
- Fortescue FY2024 Annual Report — Overview: Renewable Power and Decarbonisation, pp. 2–26; Operating and Financial Review: Decarbonisation, pp. 27–43; Climate Change Report, pp. 65–101.
- Fortescue FY2025 Annual Report — Operating and financial review: Decarbonisation, renewable power, shipping and Fortescue Zero, pp. 22–42; Climate Change Report: transition plan, energy supply, mobility and emissions, pp. 57–90.
12
12. Fortescue Energy, Fortescue Zero and Green Metal
Scope and reporting-perimeter changes
The FY2021 report called the green-energy and industry company Fortescue Future Industries (FFI). FY2022 presented Iron Ore and FFI as operating segments. In FY2023, the report described Fortescue Energy as comprising FFI, Fortescue Hydrogen Systems and Fortescue WAE. FY2024 and FY2025 reports use Fortescue Energy, Fortescue Zero, Green Metal and Fortescue Capital descriptions. These are reporting and organisational labels used in the source documents; they should not be assumed to represent the same accounting or project boundary in every year.
FY2021 — FFI establishment, studies, agreements and prototypes
- Fortescue established FFI in FY2021 as a 100%-owned renewable green-energy and industry company. The report recorded US$104m of administration expense and US$18m of capital expenditure for FFI in FY2021.
- The reported domestic technology/project list included CSIRO ammonia-to-hydrogen membrane technology; an A$32m Christmas Creek hydrogen-mobility project comprising refuelling and hydrogen passenger coaches; a combined green-hydrogen production/refuelling facility with ATCO; a Hyundai/CSIRO MOU; and a Bell Bay, Tasmania study for a 250MW green-hydrogen plant and 250,000tpa green-ammonia capacity. The report identifies the Bell Bay item as a feasibility study.
- International FY2021 FFI arrangements were a PNG deed of agreement for hydropower and green industry, an Indonesia deed giving FFI first priority for hydro/geothermal green-industry development studies, and a Kawasaki Heavy Industries/Iwatani MOU for an Australia–Japan liquid-hydrogen supply-chain business model. These were agreements/study rights, not disclosed operating plants.
- The FY2021 technology record also referred to >97% purity green iron and initial green-cement trials using green-iron waste. The report does not present those items as a commercial operating product line in that year.
FY2022 — expanded portfolio, acquisitions and technology work
- FFI was described as the wholly owned renewable green-energy and technology company supporting the stated decarbonisation strategy. Its FY2022 opportunity portfolio was stated as 120 development projects in 40 countries across wind, solar, hydropower and geothermal resources. A portfolio count is not evidence that every item had a construction, approval or operating status.
- In October 2021, FFI agreed with the Queensland Government to develop the Gladstone Green Energy Manufacturing (GEM) Centre. Stage 1 was specialist electrolyser production lines, with potential future expansion into wind turbines, solar PV cells, long-range electric cable, electrification systems and related infrastructure.
- In October 2021 FFI acquired 60% of Dutch HyET Group and financed most of the expansion of HyET Solar's Dutch solar-PV factory. The report also records MoUs with JCB/Ryze Hydrogen, Universal Hydrogen, Covestro, Airbus and E.ON; their stated subject matter was prospective hydrogen or derivative supply/use, not a disclosed delivery result.
- FFI and Incitec Pivot completed initial studies in December 2021 for conversion of Gibson Island ammonia production to green hydrogen. Advanced front-end engineering was under way for an on-site electrolyser plant described as capable of up to 50,000tpa of green hydrogen for green ammonia. The source document describes an engineering/study stage.
- Fortescue acquired WAE on 28 February 2022 for US$219m less US$9m cash acquired. WAE was described as a provider of high-performance battery/electrification technology and engineering, testing and manufacturing services. The March 2022 Infinity Train announcement described an intended regenerating battery-electric iron-ore train; the reported US$50m was study/development cost over the subsequent two years.
- The report also recorded acquisition of Ionix and a 20% interest in Sparc Hydrogen, and listed Green Pioneer, GEM and battery-electric locomotives among low-carbon developments. These transactions and developments should not be read as proof of commercial production.
FY2023 — project-stage register and new Energy components
- The FY2023 annual report described Fortescue Energy as FFI, Fortescue Hydrogen Systems and Fortescue WAE. Its stated objective was to bring up to five green-energy projects to final investment decision; the report identifies project stages but does not record FY2023 FIDs for the named projects below.
- Phoenix Hydrogen Hub, Arizona: Fortescue acquired a 100% interest for US$24m. Phase one was described as an 80MW electrolyser/liquefaction facility capable of up to 12,000 tonnes a year of liquefied green hydrogen. The record is an acquisition and project description.
- Gibson Island, Queensland: proposed 550MW green-hydrogen/green-ammonia facility with Incitec Pivot, at FEED stage.
- Nakuru County, Kenya: proposed up-to-300MW geothermal steam-to-fertiliser facility using Olkaria geothermal steam, at pre-feasibility. The report named the Kenyan Government as sole offtaker and recorded a March 2023 agreement to commence development.
- Holmaneset, Norway: proposed 300MW green-ammonia facility at pre-feasibility. A long-term conditional PPA with Statkraft and a second Bremanger power agreement were reported.
- Pecém, Brazil: proposed green-hydrogen/green-ammonia facility at Port of Pecém, Ceará, at pre-feasibility.
- Construction works at GEM had completed by FY2023 and automated production-line/testing-facility fit-out had begun. The stated initial electrolyser output capacity was 2GW, and the A$114m facility was targeted to open in early 2024. Fortescue also reported completion of a Perth R&D Technology Innovation Centre and opening of a Colorado Technology Innovation Centre.
- Fortescue WAE, acquired in FY2022 and moved into Energy reporting in FY2023, was working on batteries for mining and rail, a regenerating battery-electric iron-ore train and planned UK sites at Kidlington and Banbury. The FY2023 report says diesel-engine modification for green ammonia had been completed and that the 75m Green Pioneer was expected to conduct sea trials in the second half of calendar 2023—an expected trial, not a completed FY2023 sea trial.
- The report recorded China Baowu MOU activity on iron- and steelmaking emissions and development of a pilot installation to convert iron ore to green iron through low-temperature electrolysis, with several patent applications filed.
FY2024 — board approvals, construction and manufacturing opening
- The Christmas Creek Green Metal Project received Board approval in November 2023, with capital expenditure up to US$50m. The report described its intended use of green hydrogen, solar electricity, Fortescue ore and existing logistics, and anticipated more than 1,500tpa of green metal with first production expected in 2025. FY2024 test campaigns were reported to have improved plant stability, reduction efficiency, recovery and quantity produced; anticipated production timing remained forward-looking.
- Arizona Hydrogen: following a November 2023 final investment decision, site works began in FY2024. The stated design was an 80MW electrolyser/liquefaction facility, up to 11,000tpa liquid green hydrogen, capex up to US$550m and first production expected in 2026.
- PEM50, Gladstone: construction began on the two-phase 50MW project, reported with capex up to US$150m. The report described phase one as 30MW using Fortescue PEM electrolysers, with first production expected in 2025; phase two was an additional 20MW with commissioning targeted in 2028. These are construction and anticipated-timing statements.
- Holmaneset was Board-approved to fast-track to feasibility/front-end engineering; the reported concept was a 300MW green-ammonia facility with a potential EU Innovation Fund grant of up to €204m. Pecém was similarly fast-tracked to feasibility/front-end engineering; its annual-report description estimated 837 tonnes a day of green-hydrogen capacity. Neither statement reports an operating facility.
- Fortescue Zero formally opened the 2GW GEM Centre in FY2024. The report described it as a fully automated electrolyser-manufacturing facility and said contracts had been signed for first GEM-produced electrolyser sales. Fortescue Zero's listed offerings included high-performance batteries, high-voltage DC-DC converters, fast chargers and Elysia battery-intelligence software; it recorded a multi-year Elysia agreement with Jaguar Land Rover.
- The dual-fuel ammonia vessel Green Pioneer completed trials and was certified in Singapore port in the FY2024 reporting. Fortescue Capital was established in FY2024 as a New York-based green-energy investment accelerator, with a Board-approved business plan and work on third-party-capital relationships.
FY2025 — project pipeline review, discontinued items and current stated activities
- Fortescue Zero was described as the Group's technology/engineering business, with battery systems, autonomous-vehicle solutions and Elysia battery-intelligence software. The annual report describes Elysia functions including battery-safety warning, end-of-life notification and charging optimisation; it does not supply a consolidated FY2025 product-sales total in the evidence used here.
- The Christmas Creek Green Metal Project remained described as using hydrogen/electricity, Fortescue ore and existing logistics to make a lower-emission iron product. The report expected annual production above 1,500 tonnes from the existing Christmas Creek hydrogen facility and first production in 2026; those are company expectations, not a FY2025 commercial-output disclosure. The report stated that the technology was intended to work with hematite and magnetite.
- The dual-fuel Green Pioneer underwent a Port State Control inspection at Southampton. Fortescue said ammonia was used during stages of the Netherlands-to-south-of-France passage via Gibraltar, its first international sea passage using ammonia in the dual-fuel engines. This is a voyage/inspection event rather than a statement that the vessel or fuel is deployed across Fortescue's entire shipping fleet.
- Following a review of the global green-energy pipeline against market, policy and economics, Fortescue decided that Arizona Hydrogen in the United States and PEM50 in Gladstone would not proceed. This supersedes the FY2024 construction/FID descriptions; neither project should be shown as an operating or continuing construction project in the FY2025 status column.
- Fortescue said other pipeline projects would proceed only when commercially viable and market-ready. This is a stated gating criterion, not a timeline or investment conclusion.
- Fortescue Capital was described as a New York-headquartered investment manager and fiduciary of third-party capital for technology, decarbonisation and renewable-energy investments.
Five-year Energy / Green Metal status register
| Item | FY2021 | FY2022 | FY2023 | FY2024 | FY2025 |
|---|---|---|---|---|---|
| FFI / Fortescue Energy | FFI established; US$104m administration, US$18m capex | 120-project/40-country opportunity portfolio reported | Energy defined as FFI, Hydrogen Systems and WAE | Fortescue Energy reporting continues | Global pipeline reviewed; only market-ready projects stated to proceed |
| GEM, Gladstone | Not disclosed | Queensland agreement; Stage 1 specialist lines | Construction complete; fit-out under way | 2GW facility formally opened | Fortescue Zero technology/manufacturing activities reported |
| Arizona / Phoenix Hydrogen | Not disclosed | Not disclosed | 100% Phoenix acquisition; 80MW phase-one design | FID/site works stated | Reported decision not to proceed |
| PEM50, Gladstone | Not disclosed | Not disclosed | Not disclosed | Construction began; two-phase 50MW design | Reported decision not to proceed |
| Gibson Island | Not disclosed | Initial conversion studies/advanced engineering | FEED-stage proposed 550MW facility | No later FY24 operating result in selected evidence | No continuation detail in selected FY25 evidence |
| Holmaneset / Pecém | Not disclosed | Not disclosed | Both pre-feasibility projects | Fast-tracked to feasibility/FEED | No project-specific FY25 construction/operation disclosed in selected evidence |
| Green Metal, Christmas Creek | Green-iron trials and >97% purity result reported | No dedicated project approval identified | Low-temperature-electrolysis pilot work reported | Board-approved project and test campaigns | >1,500tpa/2026 statements remain expectations |
| Green Pioneer | Ammonia vessel design/pilot work | Listed as development | Sea trials expected | Trials/certification reported | Ammonia-fuelled international-passage event reported |
Section sources
- Fortescue Metals Group FY2021 Annual Report — Operating and financial review: Fortescue Future Industries and capital expenditure—Energy, pp. 37, 41–42; Our approach to climate change, pp. 61–64.
- Fortescue FY2022 Annual Report — Overview: Fortescue Future Industries, p. 23; Operating and financial review: Decarbonisation, Fortescue Future Industries and Williams Advanced Engineering, pp. 31–32, 40; Climate Action, pp. 68–70; Financial statements: acquisition disclosures, pp. 118–119.
- Fortescue FY2023 Annual Report — Overview: Fortescue Energy, zero-emission equipment and green iron/steel, pp. 19–27; Operating and financial review: Fortescue Energy, green energy, green industry, green steel and green technology, pp. 28–46.
- Fortescue FY2024 Annual Report — Overview: Green Energy, Fortescue Zero, Fortescue Capital and Green Metal Project, pp. 2–26; Operating and Financial Review: Metals Projects and Fortescue Energy, pp. 27–43; Directors’/Remuneration Report: strategic outcomes, pp. 102–149.
- Fortescue FY2025 Annual Report — Operating and financial review: Fortescue Zero, Green Metal, shipping, green-energy projects and Fortescue Capital, pp. 22–42; Climate Change Report: energy supply and mobility, pp. 57–90.
13
13. International exploration and development: Belinga/Gabon and other disclosed jurisdictions
Belinga, Gabon — five-year chronology
- FY2021: the selected FY2021 annual report did not disclose Belinga/Gabon activity. This absence is not treated as a zero project balance or proof that no external work existed.
- FY2022: Fortescue entered an exclusivity agreement with Gabon in December 2021 relating to Belinga. The FY2022 annual report records the agreement as an early legal/project step; it does not report an Ore Reserve, Mineral Resource, construction completion or production in that year.
- FY2023: Belinga was described as Fortescue's first iron-ore project outside Australia. In February 2023, incorporated joint-venture company Ivindo Iron SA signed a Mining Convention with the Government of Gabon, governing legal, fiscal and regulatory regimes; the report said additional legislation was proposed for FY2024. First ore was transported by train to port in June 2023. Fortescue said it remained on track for first shipment by the end of calendar 2023—an FY2023 target, not a reported FY2023 shipment completion. Its indirect interest in Ivindo Iron SA was 72%. Studies for potential large-scale development designs continued.
- FY2024: Fortescue described Belinga as a potentially large, high-grade undeveloped hematite deposit. Drilling was dominated by diamond and reverse-circulation programmes; by 30 June 2024, the company reported more than 45,000m of RC and 7,000m of diamond drilling. Pilot production shipped first ore in FY2024, which Fortescue described as its first iron-ore export outside Australia. Ivindo Iron SA remained the operating entity and Fortescue reported a 72% interest. The report said drilling results continued to indicate potential scale/high grade and work focused on large-scale-development designs; these are company characterisations and study activity, not a disclosed JORC resource/reserve.
- FY2025: Fortescue stated that exploration had begun in 2022 and reported FY2025 diamond-core and RC drilling. At 30 June 2025 it reported more than 108,000m RC and 12,000m diamond core drilled. It said results continued to indicate potential scale and grade and that the work focus was further exploration/studies for possible large-scale development designs. Ivindo Iron SA and Fortescue's 72% interest were again reported. The selected FY2025 annual report does not provide a Belinga Mineral Resource or Ore Reserve table; none is implied here.
Other named international exploration jurisdictions — annual-report status record
| Location / project | FY2021 | FY2022 | FY2023 | FY2024 | FY2025 / last selected status |
|---|---|---|---|---|---|
| Ecuador | Field work/drilling restarted | Exploration across Ecuador reported | No named update in selected ledger | No named update in selected ledger | No named update in selected ledger |
| Colombia | Not named in selected FY2021 ledger | Opportunity assessment named in the overview | No location-specific update in selected ledger | No location-specific update in selected ledger | No location-specific update in selected ledger |
| Kazakhstan | Drilling began | Drilling reported | Copper targets progressing to drilling | No location-specific activity stated in selected FY24 ledger | Active drilling reported |
| Argentina | Drilling season concluded; geological review for following field work | Drilling reported | Copper-gold prospective tenements; drilling programme reported | Drilling reported | Active drilling reported |
| Peru | Not named in selected FY2021 ledger | Exploration across Peru reported | Critical-mineral tenements; 25.4% Alta Copper stake and Cañariaco support reported | Opportunities reported | Included in broader Latin America activity, without a project-specific FY25 activity statement |
| Chile | Not named in selected FY2021 ledger | Exploration across Chile reported | Critical-mineral tenements and drilling programme reported | Drilling reported | No location-specific FY25 drilling statement in selected ledger |
| Brazil | Not named in selected FY2021 ledger | Exploration across Brazil reported | Critical-mineral tenements and drilling programme reported | Rare-earth drilling programme reported complete | No location-specific FY25 exploration result in selected ledger |
| Portugal | Not named in selected FY2021/22 ledgers | Not named | Lithium opportunities reported | Broader exploration location named | No later location-specific result in selected ledger |
| Canada | Not named in selected FY2021–23 ledgers | Not named | Not named | Broader exploration location named | Included in broader Australia/Canada activity; no project-specific FY25 result in selected ledger |
| PNG | Deed of agreement for hydropower/green industry | No later project-specific result in selected ledger | No later project-specific result in selected ledger | No later project-specific result in selected ledger | No later project-specific result in selected ledger |
| Indonesia | First-priority development-study deed for hydro/geothermal green industry | No later project-specific result in selected ledger | No later project-specific result in selected ledger | No later project-specific result in selected ledger | No later project-specific result in selected ledger |
| Japan / Australia–Japan supply chain | Kawasaki Heavy Industries/Iwatani MOU for liquid-hydrogen business-model work | No later project-specific result in selected ledger | No later project-specific result in selected ledger | No later project-specific result in selected ledger | No later project-specific result in selected ledger |
| United States | No location-specific FY2021 item | No location-specific FY2022 item | Phoenix Hydrogen acquisition; Colorado technology centre opened | Arizona project site works reported | Arizona Hydrogen reported not proceeding |
| Kenya | Not named | Not named | Nakuru/Olkaria pre-feasibility and development agreement reported | No operating result in selected FY24 ledger | No project-specific FY25 status disclosed in selected ledger |
| Norway | Not named | Not named | Holmaneset pre-feasibility and conditional PPA reported | Fast-tracked to feasibility/FEED | No project-specific FY25 construction/operation disclosed in selected evidence |
| Brazil — Pecém energy project | Not named | Not named | Pecém pre-feasibility reported | Fast-tracked to feasibility/FEED | No project-specific FY25 construction/operation disclosed in selected evidence |
| Netherlands | Not named | 60% HyET acquisition; HyET Solar factory expansion financing | No project-specific status in selected FY23 ledger | No project-specific status in selected FY24 ledger | No project-specific status in selected FY25 ledger |
| United Kingdom | Not named | Not named | Kidlington and Banbury sites planned for WAE technology work | No later site-specific status in selected evidence | No later site-specific status in selected evidence |
Australian and international critical-minerals record relevant to the international portfolio
- FY2021 Australian copper-gold work included Paterson and Rudall geophysics in Western Australia and planned follow-up drilling at Arcoona, South Australia. FY2022 reported Paterson target generation, mapping, soil sampling and geophysical surveys; it also reported drilling in Argentina and Kazakhstan and exploration across Peru, Chile, Brazil and Ecuador.
- FY2023 international drilling programmes were reported in Argentina, Chile, Brazil and Kazakhstan. Fortescue described copper-gold prospective tenements in Argentina, critical-mineral tenements in Brazil, Chile and Peru, copper targets progressing to drilling in Kazakhstan, and lithium opportunities in Portugal. It reported a 25.4% stake in Alta Copper and support for advancement of the Cañariaco project in Peru.
- FY2024 work focused on copper, rare earths and lithium. The annual report records a farm-in/JV with Magmatic Resources for Myall, through which Fortescue acquired 19.9% of Magmatic; South American work included drilling in Argentina and Chile, Peru opportunities and a completed rare-earth drilling programme in Brazil. Australia, Canada and Portugal were named as broader exploration locations.
- FY2025 stated critical-minerals focus was copper with rare-earth exposure. It reported active drilling in Argentina, Kazakhstan and Australia, with wider work in Latin America, Australia and Canada. Exploration and studies capital expenditure was US$321m. These facts do not provide a resource/reserve estimate for the named critical-minerals locations.
Status and evidence limits
- A jurisdiction being named in a Fortescue annual report is recorded here as a disclosure occurrence, not as proof of an operating mine, approved development, resource estimate, retained tenure after FY2025 or commercial outcome.
- Belinga's drilling metres, train/port events, pilot shipment and reported ownership are distinct evidence types. The selected reports do not permit them to be converted into a resource tonnage, reserve, plant capacity or project valuation.
- The report identifies study, pre-feasibility, FEED, agreement, acquisition, construction, commissioning and discontinuation stages separately in the preceding records. Where a later report does not restate an item, the table says that it was not located in the selected annual-report ledger rather than treating it as cancellation or completion.
Section sources
- Fortescue Metals Group FY2021 Annual Report — Operating and financial review: Exploration, p. 42; Operating and financial review: Fortescue Future Industries, p. 37.
- Fortescue FY2022 Annual Report — Overview: International footprint, p. 24; Operating and financial review: Fortescue Future Industries, pp. 31–32, and Exploration/Belinga exclusivity agreement, p. 37.
- Fortescue FY2023 Annual Report — Overview: Belinga Iron Ore Project, critical minerals and international exploration, pp. 19–27; Operating and financial review: Projects/Belinga and exploration, pp. 28–46; Overview and Operating and financial review: Fortescue Energy, pp. 19–46.
- Fortescue FY2024 Annual Report — Overview: Belinga and critical minerals/iron ore exploration, pp. 2–26; Operating and Financial Review: Metals Projects, critical-minerals/iron-ore exploration and Fortescue Energy, pp. 27–43.
- Fortescue FY2025 Annual Report — Operating and financial review: critical minerals and iron-ore exploration, Belinga Iron Ore Project and green-energy projects, pp. 22–42; Ore Reserves and Mineral Resources, pp. 43–53.
14
14. People, safety, environment, Traditional Owners and communities
Reading boundary
This section records what Fortescue disclosed in the FY2021–FY2025 annual reports. Safety rates are not necessarily on the same perimeter: FY2021 expressly excludes FFI from the OFR safety metric, FY2024 separately reports a Fortescue Energy rate, and the later reports use the reporting boundaries stated below. A company target, policy, programme, or material-topic list is not presented as an achieved outcome. Where the selected annual-report ledger does not provide a metric or a year-on-year basis, that gap is retained rather than filled with an estimate.
Five-year safety and workforce record
| FY ended 30 June | Disclosed safety result or event | Reported workforce / people actions and boundary notes |
|---|---|---|
| 2021 | Rolling 12-month TRIFR was 2.0, compared with 2.4 at 30 June 2020; the OFR stated a 17% improvement. Fortescue reported no fatalities. It also reported a 13.5% reduction in risk and a 19.4% reduction in exposure. | The OFR safety rate excludes FFI. Disclosed actions included leadership plans based on the Safety Excellence and Culture Survey, contractor-compliance work, workplace-exposure reduction and physical/mental-health measures. COVID-19 measures included screening, changed village services and cleaning, temporary roster/work-from-home arrangements during WA lockdowns, and accommodation arrangements for interstate workers. Fortescue reported no COVID-19 cases across Pilbara operational sites at 30 June 2021. |
| 2022 | Rolling 12-month TRIFR was 1.8, stated as 10% below FY2021. Team member David Armstrong died following an incident at Solomon Hub on 30 September 2021. The report states that Fortescue continued to work with the Western Australian mines regulator and to support colleagues and family. | COVID controls continued, including travel/accommodation, screening, village-service and vaccination-status measures. A Workplace Integrity Review, launched in July 2021, was described as a process to hear directly from employees and contractors about sexual-harassment factors; the report said initiatives were being implemented in response. It also reported that more than 1,000 Aboriginal people had completed VTEC training and commenced full-time employment since the programme began in 2006; this is a cumulative programme figure, not FY2022 hires. |
| 2023 | Fortescue Metals’ rolling 12-month TRIFR was 1.8 at 30 June 2023. The selected annual-report text describes leadership, frontline-designed improvements, data analytics and physical/mental-health initiatives, but does not give a complete incident count in the retained ledger. | The report’s materiality process identified 12 topics across People, Planet and Process. It described the Board ARMSC as sustainability overseer and the executive Sustainability Committee as meeting at least quarterly. The latter approved site-specific water targets for Eliwana and Solomon in FY2023. |
| 2024 | Fortescue Metals’ rolling 12-month TRIFR was 1.3 at 30 June 2024 (FY2023: 1.8). The sustainability disclosure records zero fatalities, a 25% injury-profile reduction, and a separately reported Fortescue Energy TRIFR of 0.5. | Reported actions included employee-experience-survey leadership actions, major-hazard and exposure-risk reduction, AI/advanced analytics, physical and mental-health measures, and psychosocial-hazard controls. Women were 24% of the workforce, 29% of leadership and 37% of senior leadership; FY2023 comparatives in the report were 23%, 26% and 30%. |
| 2025 | Rolling 12-month TRIFR was 1.3 at 30 June 2025. The report describes frontline risk reduction, data-informed action plans, psychosocial-hazard integration and AI-assisted identification, prioritisation and monitoring of controls. It does not state a FY2025 fatality figure in the selected ledger. | The overview states a workforce of more than 16,000. Women were reported as 25% of the workforce, 30% of leadership and 40% of senior leadership. First Nations Australians were 12% of the Australian workforce and 16% of Pilbara roles. The report characterises these measures as increases on FY2024. |
The succession of TRIFR values is a reported indicator series, not a substitute for the disclosed fatality/event record: the FY2022 Solomon Hub fatality remains a separate reported event, and the annual-report perimeters above must be retained when comparing values.
First Nations, heritage, community and human-rights record
FY2021 reporting structure. Fortescue’s FY2021 materiality assessment listed Aboriginal heritage; Aboriginal employment and business; communities; and human rights among its identified material issues. The report placed Board sustainability oversight with the Audit, Risk Management and Sustainability Committee (ARMSC), with the CEO/Director Sustainability and Corporate Affairs and an executive Sustainability Committee holding stated operational roles. This establishes the governance framing of the disclosure; it is not itself a quantified heritage or community outcome.
FY2022 performance dashboard and programmes. The FY2022 sustainability dashboard recorded zero significant heritage incidents, 5% spend with Aboriginal businesses and 5% spend with Pilbara suppliers, alongside the Aboriginal employment/business target measures shown in that dashboard. The same reporting family records the cumulative VTEC outcome above. The report did not permit this record to assume that all FY2022 procurement or employment is covered by the named programmes.
FY2023 community and policy items. The FY2023 report states that Fortescue’s Billion Opportunities programme had awarded more than A$4.6bn in contracts to First Nations businesses since its establishment in 2011. This is cumulative from programme commencement, not a single-year FY2023 award figure. It also records ARMSC endorsement of a revised Environment Policy, a Free, Prior and Informed Consent (FPIC) Position Statement and a revised Human Rights Policy. Social/community investment was A$101.8m in FY2023, compared with A$77.4m in FY2022 in the report’s comparison. These figures are reported investment amounts and do not measure project-level community outcomes.
FY2024 workforce, procurement and social-investment disclosures. First Nations employment was reported as 11% of the Australian workforce, 15% of Pilbara operations and 5% of leadership roles. Spend with First Nations Australian businesses was reported as 7%, compared with 5% for FY2023. Social investment was presented as $86.7m (FY2023: $101.8m; FY2022: $77.4m); the annual-report table available to this report did not specify the currency in that display, so the currency is not inferred here. Fortescue also reported becoming a full member of the Voluntary Principles Initiative in May 2024 and 639 employees completing advanced anti-bribery and corruption training.
FY2025 boundary. The FY2025 record identifies community and First Nations heritage impacts among the company’s material-risk categories, and reports the FY2025 First Nations workforce/Pilbara-role percentages in the table above. A material-risk disclosure is a description of a risk category, not a statement that a heritage or community-impact event occurred in FY2025.
Environment, water, biodiversity, waste, closure and rehabilitation
| FY | Reported environmental / water / closure facts | Definition or comparison caution |
|---|---|---|
| 2021 | The FY2021 material-issues framework included climate, biodiversity, water and tailings. | The selected FY2021 ledger does not provide a comparable annual water, waste, biodiversity-investment or incident KPI; those topic names are not converted into performance results. |
| 2022 | The sustainability dashboard reported zero environmental incidents, 99% Chichester water-use result, 83% non-mineralised waste recycling, and closure plans for 100% of major operational sites. | The dashboard also included target measures. The record does not assume that “zero environmental incidents” and every later “no significant environmental incidents” use an identical threshold or reporting boundary. |
| 2023 | The report recorded zero significant environmental incidents, A$4.7m invested in research/conservation programmes, 96% operational/beneficial water use at Cloudbreak/Christmas Creek against an at-least-80% target, closure plans for 100% of major operational sites, and 81% of non-mineralised waste recycled excluding tyres and concrete. It stated that site-specific water targets had existed at Chichester since FY2019 and were set for Eliwana and Solomon in FY2023. | The 96% water metric is specifically stated for Cloudbreak/Christmas Creek and for the operational/beneficial-water definition used by the company. It is not a group-wide water-use rate. The stated FY2024 next steps—piloting a water-accounting framework at Eliwana and completing a Solomon water-efficiency assessment—were future actions in the FY2023 report. |
| 2024 | Fortescue reported no significant environmental incidents, release of a Metals Biodiversity Strategy, $6.0m invested in research/conservation, closure plans for 100% of major operational sites, and 81% waste recycled (FY2023: 81%; FY2022: 83%). It also reported releasing a Life-Cycle Assessment guideline and procedure. | The selected annual-report table does not establish a currency for the $6.0m figure in this record, so none is added. “No significant environmental incidents” is reproduced with the company’s qualifier. |
| 2025 | The selected FY2025 ledger continues to identify restoration/rehabilitation obligations as an accounting/audit area, and identifies community/First Nations heritage impacts in the risk framework. | These disclosures are not a FY2025 environmental-incident count. Rehabilitation provisions are estimates of future work scope, cost, inflation, discount rates and timing, not a physical closure-progress KPI. |
Tailings were a named FY2021 material issue. The retained five-year ledgers used for this section do not provide a quantitative tailings-performance series. The absence of a number in this record must not be read as zero tailings risk, zero tailings facilities, or an unreported performance conclusion.
Section sources
- Fortescue Metals Group Ltd FY21 Annual Report — Operating and financial review: Safety, ongoing COVID-19 response and safety culture, pp. 25–26; Our approach to sustainability, pp. 53–57; Corporate Governance, pp. 58–60; Our approach to climate change, pp. 61–64.
- Fortescue FY22 Annual Report — Operating and financial review: Safety, ongoing COVID-19 response and safety culture, pp. 28–29; Our approach to sustainability and performance dashboard, pp. 60–64; Corporate Governance, pp. 65–67; Climate Action, pp. 68–70.
- Fortescue FY23 Annual Report — Operating and financial review: Safety, pp. 28–46; Our approach to sustainability: governance, materiality and performance, pp. 57–61; Corporate governance, pp. 62–64; Directors’ Report, pp. 70–73.
- Fortescue FY24 Annual Report — Operating and Financial Review: Safety culture and relevant risk factors, pp. 27–43; Corporate Governance, pp. 55–57; Our Approach to Sustainability, pp. 58–64; Climate Change Report, pp. 65–101; Directors’/Remuneration Report, pp. 102–149; Financial Report, pp. 150–224.
- Fortescue FY25 Annual Report — Overview / Operating and financial review: safe workforce and material-risk exposures, pp. 4–42; Sustainability approach, pp. 54–56; Corporate Governance Statement, pp. 91–123; Financial Report / Independent auditor’s report, pp. 168–242.
15
15. Climate, governance, risk, remuneration and accounting boundaries
Climate: annual results, targets, methodology and boundary changes
| FY | Reported emissions / operational information | Plans, targets, scenarios or methodological qualifications |
|---|---|---|
| 2021 | Gross operational emissions were 2.22m tCO2-e: Scope 1 2.06m and Scope 2 0.16m. Offsets reduced net emissions to 2.01m tCO2-e, reported as 3% below the FY2020 operational baseline. | In March 2021 Fortescue announced a carbon-neutrality-by-2030 target, framed in the report as net Scope 1 and 2 emissions across existing and future operations falling to zero by 2030. The FY2021 climate-risk assessment listed policy/regulation, technology viability, demand and reputation transition risks and acute/chronic physical risks. Those categories are risk assessment, not events. |
| 2022 | The report gives gross operational emissions of 2.55m tCO2-e and separately gives 1.90m Scope 1 and 0.33m Scope 2 in its FY2022 performance disclosure. It reported renewable electricity from the Chichester solar-gas project reduced electricity-emissions intensity from 3.50 to 3.32. Gross Scope 3 emissions were 255m tCO2-e; the report says offsets were procured/surrendered so net emissions were 2.28m tCO2-e, 3% below the FY2020 operational baseline. | The figures are reproduced separately because the retained ledger does not establish how every component of the stated gross total is reconciled in the cited text. FY2022 climate-risk categories again covered transition, acute-physical and chronic-physical risks. |
| 2023 | Gross Scope 1 and 2 emissions were 2.55m tCO2-e: Scope 1 2.20m and Scope 2 0.35m. The operational-control boundary stated in the report included Australian iron-ore operations, eight ore carriers and nine Port Hedland tugboats. Renewable purchased electricity was 145.7 GWh and non-renewable purchased electricity 567 GWh; diesel consumption was 633m litres and gas consumption 4.1 PJ. Gross Scope 3 was 267.61m tCO2-e, including 261.46m from crude-steel manufacturing, 2.86m from chartered cargo shipping and 2.50m from purchased goods/services. | The FY2023 Board-approved roadmap was stated as US$6.2bn and sought Real Zero—elimination of fossil-fuel use and Scope 1/2 terrestrial emissions at Australian iron-ore operations—by 2030. Fortescue said it had identified solutions for about 90% of those emissions and was working on the remainder. It stated that voluntary Scope 1/2 offsets would cease from FY2024 unless legally required. The report also stated net-zero Scope 3 by 2040 and zero controlled-marine-vessel emissions by 2030 as targets, not results. It attributed the Scope 3 increase to methodology changes, higher iron-ore output, product mix and destination markets. |
| 2024 | Sustainability reporting gives Scope 1 and 2 emissions from Australian terrestrial iron-ore operations of 2.38 MtCO2-e (FY2023: 2.28; FY2022: 2.23). Customer steelmaking emissions intensity was 1.37 tCO2-e/t ore and shipping intensity 0.019 tCO2-e/t ore. | The FY2024 annual report’s stated target was Real Zero Scope 1 and 2 terrestrial emissions from Australian iron-ore operations by 2030, with net-zero Scope 3 by 2040; it defines Real Zero as no fossil fuels and no offsets. It reported identifying solutions for approximately 90% of terrestrial Scope 1/2 emissions and a programme requiring additional 2–3GW renewable generation/storage plus a green fleet and locomotives. These are company statements of target and programme, not an achieved 90% reduction. FY2024 decarbonisation capex was reported as US$224m, including PEC. |
| 2025 | Location-based Scope 1 and 2 emissions from Australian terrestrial iron-ore operations were 2.66 MtCO2-e: Scope 1 2.29m and Scope 2 0.37m. The report states that the increase from FY2024’s 2.38m reflected the transition plan, while energy-efficiency initiatives limited it to 11.6%, about 5% below budgeted emissions. Scope 3 was 275.88 MtCO2-e; Category 10 processing of sold products was 269.20 MtCO2-e and represented 98% of Scope 3, against 198.4mt shipped. Steelmaking intensity was 1.357 tCO2-e/t, versus 1.368 in FY2024 and a FY2021 baseline of 1.310. Shipping intensity was 0.019 tCO2-e/t in FY2025 and FY2024, versus a restated FY2021 baseline of 0.022. | FY2025 disclosed decarbonisation capex of US$405m and FY2026 guidance of US$900m–US$1,200m. The stated targets are Real Zero Scope 1/2 for Australian terrestrial Pilbara iron-ore operations by 2030; a 7.5% reduction in steelmaking-emissions intensity by 2030 from FY2021; a 50% reduction in shipping-emissions intensity by 2030 from FY2021; and net-zero Scope 3 by 2040. The annual report describes all as targets. It states Fortescue ceased voluntary Scope 1/2 offsets in 2023, using credits only where legislation requires them, and expected approximately 240,000tCO2-e FY2025 excess over Safeguard Mechanism baselines. |
The FY2021–FY2025 emissions rows are not a mechanically homogeneous trendline. The FY2023 operational-control boundary expressly included marine assets, whereas FY2024 and FY2025 values cited here are titled Australian terrestrial iron-ore operations. FY2025 shipping comparisons also use a restated FY2021 baseline. These reporting-boundary and baseline qualifications remain attached to the data.
Climate scenarios, governance and implementation dependencies
Fortescue’s FY2025 report says its internal corporate model uses carbon-cost scenarios in investment and life-of-mine planning. The disclosed close assumptions were A$47/t in FY2026 rising to A$89/t in FY2032, sourced from third-party RepuTex forecasts and updated quarterly. These are internal modelling assumptions, not MII price forecasts or a forecast of realised carbon cost.
The FY2025 report identifies policy and regulatory certainty, approvals, social licence, technology scale-up, contractors, supply chain, carbon pricing/incentives, grid infrastructure and access to water/renewable energy as dependencies. FY2024 separately states that technology adaptation/development and technology/supply-chain availability and maturity were material implementation issues. They are disclosed dependencies and risks, not statements that any one dependency caused a future outcome.
Board and management oversight changed across the period. FY2021 described ARMSC Board oversight and executive Sustainability Committee meetings at least quarterly. FY2023 reports ARMSC endorsement of the revised Environment Policy, FPIC Position Statement and revised Human Rights Policy. FY2024 reports a double-materiality assessment and, effective 1 July 2024, a committee structure of Audit, Finance and Risk Management; People, Remuneration and Nomination; and Safety and Sustainability. The FY2025 record cites the Fortescue Risk Management Framework as the Board-and-management framework for assessing material risks.
Principal risks: disclosure register, not event register
The annual reports identified, at different dates and with changing specificity, the following risk families: policy/regulation, technology viability, product demand and reputation; acute weather/heat/bushfire and chronic sea-level, storm-surge or precipitation changes; commodity-price, currency, interest-rate and funding exposure; supply/cost pressure; project execution; unplanned disruption; reserve/resource uncertainty; counterparty performance; cyber/technology; workforce capacity; legal/regulatory compliance; and community/First Nations heritage impacts.
FY2022 specifically identified Iron Bridge cost pressure, global supply-chain constraints, COVID-19-related challenges, labour availability and specialist-skills access in the project discussion. FY2024 additionally recorded risk/disclosure context around Iron Bridge raw-water-pipeline ramp-up, external inflation and labour costs, a higher strip ratio, recovery from an early-Q3 derailment, market/product-mix factors, Belinga study/exploration uncertainty and accounting judgement on Iron Bridge recoverable amount. These are presented as report-disclosed risks, constraints, dependencies or accounting matters. Only facts explicitly described by the company as occurring—for example the FY2024 raw-water-pipeline ramp-up issue—are identified as an operating fact; the surrounding risk list is not recast as a series of losses or incidents.
Remuneration, ownership and governance boundary
The FY2021 report states that Fortescue reported against the ASX Corporate Governance Council’s fourth-edition principles unless otherwise disclosed, and states governance principles of transparency, integrity, empowerment, corporate accountability and stewardship. FY2022 and FY2023 repeat support for that fourth-edition framework in the cited governance disclosures.
The FY2023 annual report disclosed directors’ interests including 1,131,365,000 ordinary shares for Dr Andrew Forrest AO at 30 June 2023. This is an issuer disclosure of a director’s interest; it is included to preserve the reporting boundary, not to imply control, value or an investment conclusion.
The FY2024 report directed detailed remuneration and strategic-performance information to the Directors’/Remuneration Report. Its specific annual-report performance record stated that Iron Bridge’s ramp-up to the budgeted outcome had not been achieved because of raw-water-pipeline performance, with a water-banking strategy and work on additional West Canning Basin water-abstraction licensing described by the company. This is a disclosed operating/project-performance item, not a remuneration assessment by MII.
Accounting, audit and restatement boundaries
- Segment / reporting change. In FY2023 Fortescue described two divisions, Metals and Energy. Fortescue WAE, previously reported within Metals, was included in Energy; FY2022 segment comparatives were restated to match that structure. Group cash, debt and tax were managed at Group level and reported as Corporate rather than an operating segment. Segment figures before and after this presentation change must not be treated as an unchanged series.
- Iron Bridge ownership and basis. The reports identify a 69% Fortescue interest in the Iron Bridge unincorporated joint venture. Where annual-report operating, resource/reserve or financial figures use 100% basis or Fortescue share, that stated basis is retained rather than silently converted.
- Iron Bridge impairment. FY2023 recognised a US$1,037m pre-tax (US$726m post-tax) Iron Bridge impairment. The FY24 report presents that FY23 result as a comparative. In FY2024, no Iron Bridge CGU impairment indicators were identified. In FY2025, management identified impairment indicators, performed an assessment and recognised no impairment expense. These are year-specific accounting outcomes; a later no-impairment result does not reverse or erase the FY2023 charge.
- Critical estimates and audit matters. The FY2024 financial statements identify material judgement in the Iron Bridge CGU recoverable-amount assessment, including iron-ore price, FX, discount rate, recoverable resources, production, costs and capital. FY2025’s independent auditor treated Iron Bridge CGU impairment and restoration/rehabilitation obligations as key audit matters. The recoverable-amount assessment used FVLCD discounted cash flows and depends on judgemental inputs; rehabilitation provisions depend on estimated work scope, costs, inflation, discount rates and timing. These disclosures describe accounting estimates and audit focus, not MII valuation.
- Resource / accounting caveat. The FY2025 report says resource and reserve figures require geological, technical and economic assumptions, and changes in production/sales volumes, prices, costs, rehabilitation, capital, climate-related risks and useful lives may affect asset recoverability. This is an accounting and estimation caveat; it is not a forecast of impairment or resource change.
Section sources
- Fortescue Metals Group Ltd FY21 Annual Report — Operating and financial review, pp. 25–42; Our approach to sustainability, pp. 53–57; Corporate Governance, pp. 58–60; Our approach to climate change, pp. 61–64.
- Fortescue FY22 Annual Report — Operating and financial review: decarbonisation, revenue and Iron Bridge, pp. 31, 34, 36; Our approach to sustainability, pp. 60–64; Corporate Governance, pp. 65–67; Climate Action, pp. 68–70; Financial statements: Financial risk management, p. 103.
- Fortescue FY23 Annual Report — Overview: Decarbonisation, zero-emission equipment and renewable power, pp. 19–27; Operating and financial review: decarbonisation and segment reporting, pp. 28–46; Our approach to sustainability, pp. 57–61; Corporate governance, pp. 62–64; Climate change, pp. 65–69; Directors’ and remuneration reports, pp. 70–108; Financial report, pp. 109–171.
- Fortescue FY24 Annual Report — Operating and Financial Review, pp. 27–43; Corporate Governance, pp. 55–57; Our Approach to Sustainability, pp. 58–64; Climate Change Report, pp. 65–101; Directors’/Remuneration Report, pp. 102–149; Financial Report, pp. 150–224.
- Fortescue FY25 Annual Report — Overview / Operating and financial review, pp. 4–42; Ore Reserves and Mineral Resources, pp. 43–53; Sustainability approach, pp. 54–56; Climate Change Report, pp. 57–90; Corporate Governance Statement, pp. 91–123; Financial Report / Independent auditor’s report, pp. 168–242.
16
16. Primary sources, AI-led methodology and information notice
Primary sources
- Fortescue FY21 Annual Report and Appendix 4E
- Fortescue FY22 Annual Report and Appendix 4E
- Fortescue FY23 Annual Report
- Fortescue FY24 Annual Report
- Fortescue FY25 Annual Report and Appendix 4E
The official Fortescue Results and operational performance page is the Investor Centre index for these reports. Section-end document/FY/page references in Sections 1–15 remain the fact-location record.
AI-led methodology
Artificial intelligence tools were actively and extensively used and led substantial parts of evidence extraction, comparison, organisation, calculation, drafting, translation and presentation. Material claims were reviewed against the cited public sources before publication, but errors, omissions, inconsistencies or misinterpretations may remain because of limitations in AI systems, source materials and review scope.
Any AI-generated visual used with this record must carry an adjacent, visible label or caption identifying it as AI-generated. A visual is illustrative only and is not source evidence, a scale drawing, a geological model, a production chart or a substitute for the cited annual-report tables. The material-claim review described above is a reasonable editorial review against the cited public sources; it is not an audit, assurance engagement or independent verification.
Information notice
This is general information, not financial-product, investment, legal, tax, technical or environmental advice, and is not a recommendation to buy, sell or hold a security. Readers should independently verify information and must not use it as the sole basis for a decision.
MII Research, its authors, contributors and affiliates make no representation or warranty, express or implied, as to accuracy, completeness, reliability, currency or fitness for a particular purpose. To the maximum extent permitted by law, they disclaim liability for direct, indirect, incidental, consequential, opportunity or investment loss arising from use of or reliance on this material. Nothing excludes liability that cannot lawfully be excluded. Suspected errors may be reported and may be corrected in a later version.
17
Public discussion
Comments
Verified members' comments appear immediately. Market manipulation, unverified inside information, impersonation, financial solicitation, referral links, personal data and abusive content may be blocked. Signed-in members can report a published comment for review.
No published comments yet.